Beschreibung
🚀 Volume Profile Pro für cTrader
Entdecken Sie die wahre Struktur hinter der Kursbewegung mit Volume Profile Pro, einem leistungsstarken und vollständig anpassbaren Volumen-nach-Preis-Indikator, der speziell für professionelle cTrader-Händler entwickelt wurde.
Dieses fortschrittliche Tool visualisiert individuelle Volumenprofile pro ausgewähltem Zeitrahmen, sodass Sie genau sehen können, wo institutionelle Aktivitäten konzentriert sind – direkt in Ihrem Chart.
🔎 Was es tut
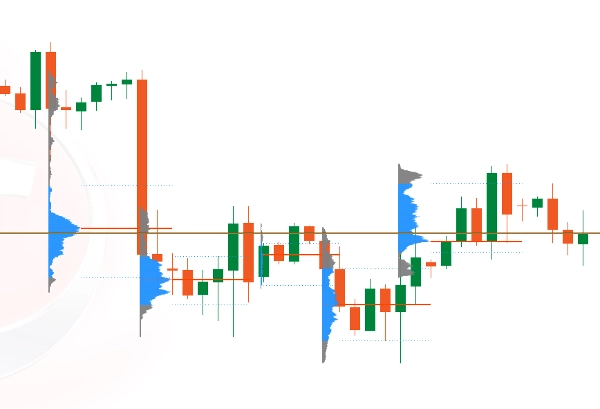
Volume Profile Pro berechnet und zeigt Volumenverteilung über einen festen Bereich für jede abgeschlossene Periode (H1, M15, D1 usw.), direkt auf der Preisachse für eine präzise Strukturanalyse dargestellt.
Jedes Profil:
- Wird individuell pro Periode gezeichnet
- Verwendet einen konsistenten festen Preisbereich
- Zeigt die Volumenverteilung pro Preisniveau an
- Hebt wichtige institutionelle Niveaus hervor
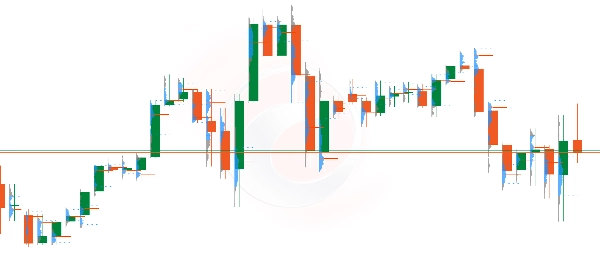
Profile sind sauber links von jeder Kerze positioniert, um eine klare Strukturerkennung zu gewährleisten, ohne die Kursbewegung zu behindern.
⚡ Hauptmerkmale
✔ Individuelle Volumenprofile pro Zeitrahmen
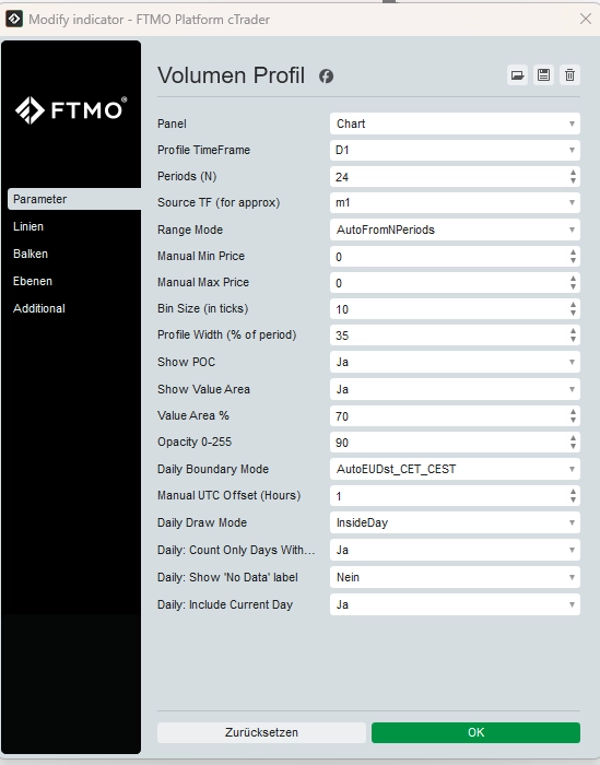
✔ Wählbarer Profilzeitrahmen (M15, H1, H4, D1 usw.)
✔ Fester Preisbereich (automatisch oder manuell)
✔ Hervorhebung des Point of Control (POC)
✔ Value Area High (VAH) & Value Area Low (VAL)
✔ Sanfte Darstellung ohne Flackern im Chart
✔ Vollständig für Leistung optimiert
✔ Entwickelt für CFD- und Tick-Volumen-Umgebungen
📊 Warum Händler es verwenden
- Institutionelle Akkumulations- und Distributionszonen identifizieren
- Reaktionsniveaus mit hoher Wahrscheinlichkeit erkennen
- Ausbruchsstärke bestätigen
- Einstiege innerhalb von Konsolidierungsbereichen verfeinern
- Volumenstruktur mit Kursbewegung in Einklang bringen
Egal, ob Sie Scalper, Intraday-Trader oder Swing-Trader sind, Volume Profile Pro verschafft Ihnen einen strukturellen Vorteil.
⚠ Wichtiger Hinweis
Das Volume Profile ist ein Trading-Software-Tool und stellt keine Finanz- oder Anlageberatung dar.
Der Handel mit Forex, CFDs und anderen Finanzinstrumenten birgt erhebliche Risiken und kann zum Verlust des eingesetzten Kapitals führen.
🎯 Entwickelt für Präzision. Konzipiert für Profis.
Bringen Sie Ihre Marktstrukturanalyse auf die nächste Stufe und handeln Sie mit Klarheit, Vertrauen und Kontrolle.
Zusammenfassung
Kundenbewertungen
5 | 100 % | |
4 | 0 % | |
3 | 0 % | |
2 | 0 % | |
1 | 0 % |