
IR Multi Data
Indikator
100 downloads
Version 1.0, Jan 2025
Windows, Mac
5.0
Bewertungen: 1
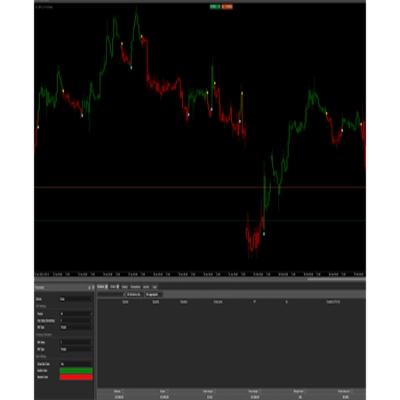
Beschreibung
Zeige Symbol und Zeitrahmen, täglichen Nettogewinnprozentsatz, täglichen Nettogewinn und Spread in deinem Chart an.
Beachte, dass die Zeitzone auf UTC eingestellt sein muss, um den täglichen Gewinn korrekt anzuzeigen.
Zusammenfassung
Indikatorprofil
Kundenbewertungen
5.0
Bewertungen: 1
5 | 100 % | |
4 | 0 % | |
3 | 0 % | |
2 | 0 % | |
1 | 0 % |
Diskussion
Häufig gestellte Fragen (FAQ)
Über den cTrader Store verfügbare Produkte, einschließlich Handelsbots, Indikatoren und Plugins, werden von externen Entwicklern bereitgestellt und nur zu Informations- und technischen Zugriffszwecken verfügbar gemacht. cTrader Store ist kein Broker und erbringt keine Anlageberatung, persönlichen Empfehlungen oder eine Garantie für zukünftige Performance.
Mehr von diesem Autor


Preis
5.12K
Kostenlose Installationen