
Beschreibung
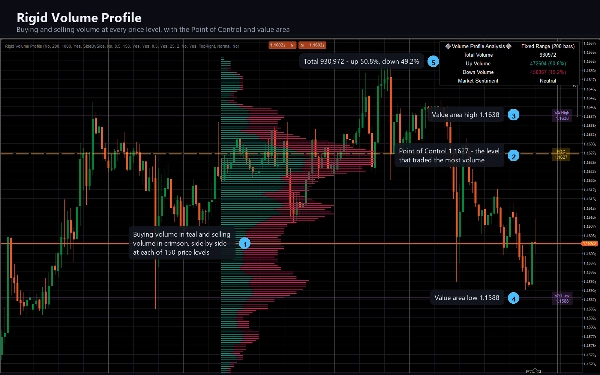
Rigid Volume Profile teilt Ihr Rückblickfenster in eine feste Anzahl von Preisniveaus auf und zeigt, wie viel Volumen auf jedem gehandelt wurde, aufgeteilt in Kauf- und Verkaufsdruck.
WAS ES ZEICHNET
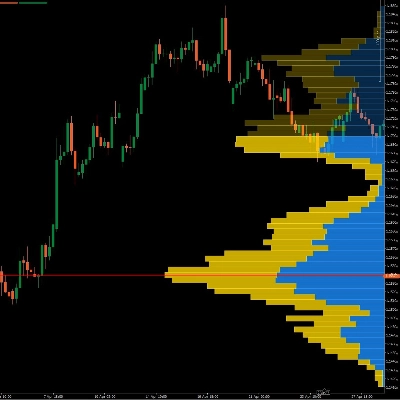
Ein horizontaler Histogramm neben der Kursbewegung, aufgebaut aus den letzten N Kerzen. Die Balken jedes Niveaus sind aufgeteilt in bullisches Volumen (von Kerzen, die nach oben geschlossen haben) und bärisches Volumen (von Kerzen, die nach unten geschlossen haben), sodass Sie nicht nur sehen können, wo gehandelt wurde, sondern auch, welche Seite dies tat. Kerzen, die unverändert schlossen, teilen ihr Volumen gleichmäßig zwischen beiden auf.
Eine gestrichelte Point of Control-Linie markiert das Preisniveau, auf dem im Fenster das meiste Volumen gehandelt wurde, beschriftet mit seinem genauen Preis.
Zwei Value-Area-Linien begrenzen die Niveaus, die 70 % des Volumens im Fenster ausmachen, jeweils beschriftet.
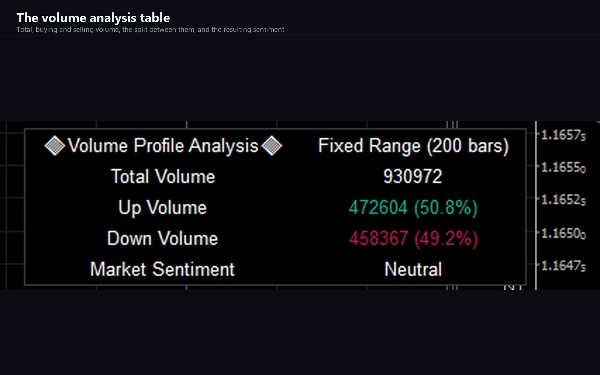
Eine Volumenanalyse-Tabelle berichtet Gesamt-, Aufwärts- und Abwärtsvolumen mit Prozentsätzen sowie eine Sentiment-Bewertung basierend darauf, welche Seite dominiert.
WIE MAN ES BENUTZT
Volumenprofile beschreiben, wo tatsächlich gehandelt wurde, und nicht nur, wo der Preis sich bewegt hat. Ein Niveau, das viel Volumen absorbiert hat, ist ein Niveau, das vielen Teilnehmern wichtig ist; ein dünner Teil des Profils ist ein Preisbereich, den der Markt schnell durchlaufen hat.
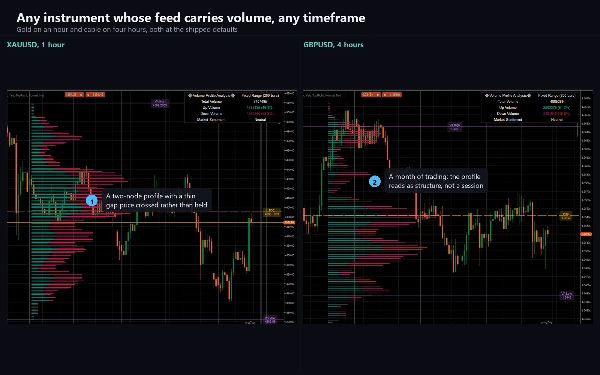
Lesen Sie den Point of Control als den Schwerpunkt des Fensters. Lesen Sie die Value Area als den Bereich, in dem der Großteil des Geschäfts abgewickelt wurde. Lesen Sie eine dünne Lücke zwischen zwei starken Knoten als eine Zone, die der Preis eher durchquert als verweilt. Beobachten Sie, welche Seite der Aufteilung ein Niveau dominiert, wenn der Preis dorthin zurückkehrt.
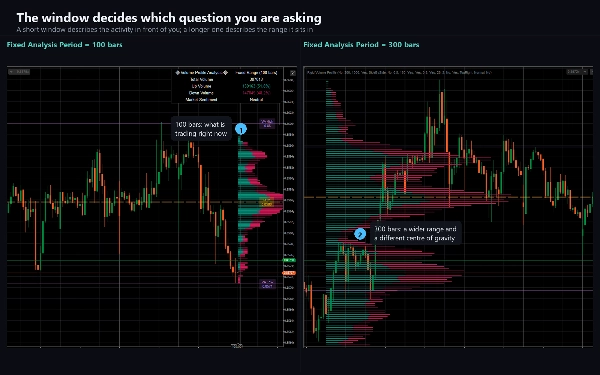
Das Fenster können Sie selbst wählen, und das Bild ändert sich damit, wählen Sie also einen Rückblick, der zu der Entscheidung passt, die Sie treffen. Ein 100-Kerzen-Profil beantwortet eine andere Frage als ein 500-Kerzen-Profil.
WICHTIGE EINSTELLUNGEN
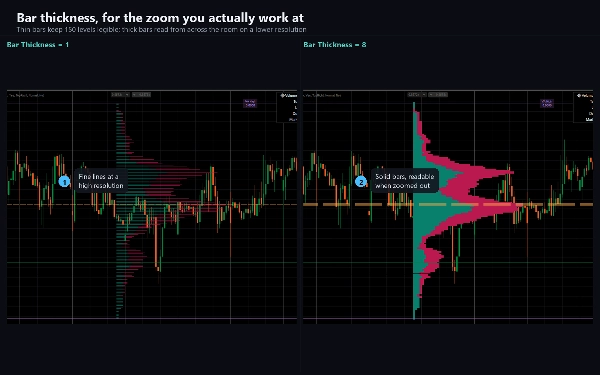
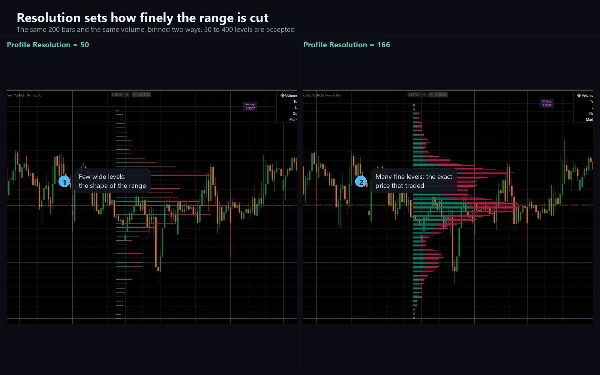
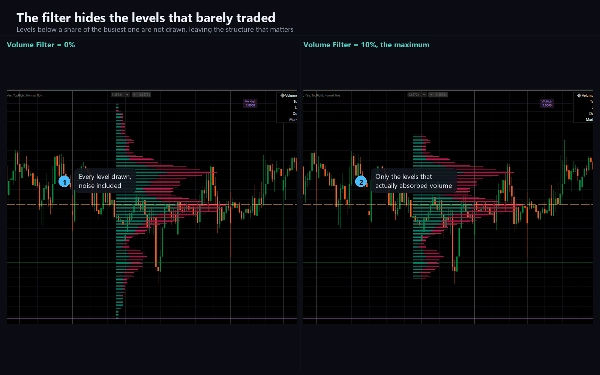
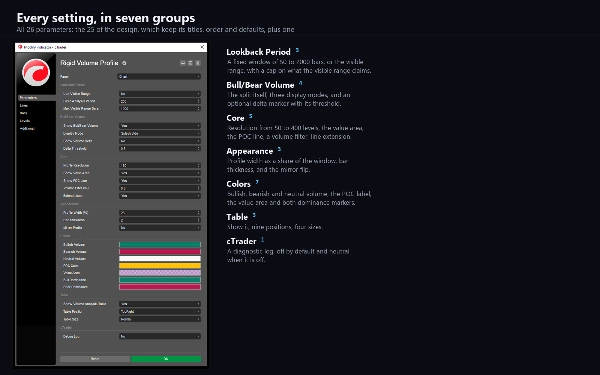
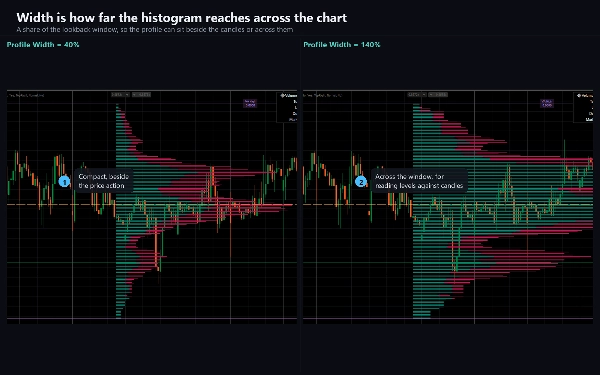
Fixed Analysis Period legt den Rückblick in Kerzen fest, von 50 bis 2000. Profile Resolution legt fest, in wie viele Preisniveaus der Bereich unterteilt wird, von 50 bis 400; weniger Niveaus lesen sich wie ein klassisches Profil, mehr geben feine Details. Display Mode bietet Side by Side, Stacked und Split. Profile Width skaliert das Histogramm als Prozentsatz des Rückblicks. Volume Filter blendet Niveaus unter einem Prozentsatz des geschäftigsten aus. Show Volume Delta fügt eine Markierung hinzu, wo eine Seite klar dominiert. Jede Farbe ist anpassbar, und die Analysetabelle kann an neun Positionen verschoben oder ausgeschaltet werden.
Use Visible Range schaltet den Rückblick auf die aktuell sichtbaren Kerzen um, anstatt eine feste Anzahl zu verwenden.
INDIKATORTYP UND FENSTER
Chart-Overlay. Es zeichnet direkt auf dem Kurschart, nicht in einem separaten Fenster.
ZEITRAHMEN UND INSTRUMENTE
Jeder Zeitrahmen. Es ist am nützlichsten intraday, von M5 bis H4, wo die Volumenverteilung einer Sitzung ein bedeutungsvolles Objekt ist.
Funktioniert bei jedem Instrument, dessen Feed Volumen liefert. Beim Forex ist das Tick-Volumen, die Anzahl der Kursupdates pro Kerze, was ein Proxy für Aktivität und nicht für gehandelte Größe ist. Bei Index- und Rohstoff-CFDs liefern einige Broker echtes Börsenvolumen, und das Profil ist dort aussagekräftiger. Bei einem Instrument ohne Volumen wird nichts gezeichnet.
FÜR WEN ES GEEIGNET IST
Trader, die bereits mit Volumenprofilen arbeiten und eines mit einem anpassbaren festen Raster und einer expliziten Kauf- und Verkaufsaufteilung wollen, anstatt eines festen Sitzungsprofils.
TESTVERSION
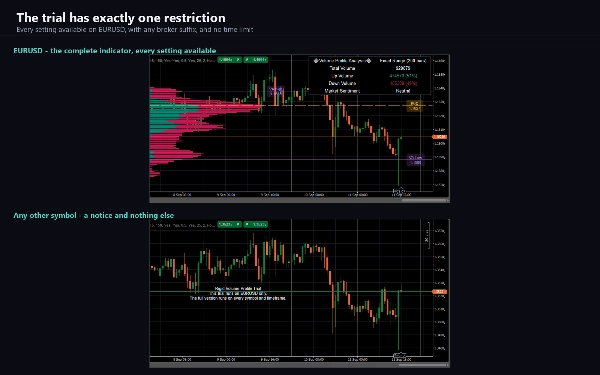
Eine Testversion ist diesem Produkt beigefügt. Es ist der vollständige Indikator mit allen verfügbaren Einstellungen, beschränkt auf EURUSD. Die Vollversion entfernt diese Beschränkung und fügt sonst nichts hinzu.
TECHNISCHE HINWEISE UND EINSCHRÄNKUNGEN
Das Profil wird bei jedem Tick der sich bildenden Kerze neu berechnet, sodass sich Point of Control und Value Area innerhalb einer Kerze bewegen und sich beim Schließen stabilisieren. Dies ist beabsichtigt. Hier gibt es kein Signal für geschlossene Kerzen.
Bei Profile Resolution über 166 werden die niedrigsten Preisniveaus nicht gezeichnet. Dies ist eine bewusste Designbeschränkung, die einen festen Pool von Zeichenobjekten reserviert und drei pro Preisniveau verwendet; die Umschalter Show POC Line und Show Value Area geben jeweils ein freies Objekt frei. Halten Sie Profile Resolution bei 166 oder darunter, um das vollständige Profil zu sehen.
Die Value Area wird gebildet, indem Niveaus nach Volumen sortiert und in dieser Reihenfolge genommen werden, bis 70 % erreicht sind, dann werden der höchste und niedrigste Preis unter ihnen berichtet. Sie ist daher normalerweise breiter als eine Value Area, die vom Point of Control aus nach außen gebildet wird.
Da das Profil aus dem Volumen Ihres Brokers gebildet wird, erzeugen zwei Broker kein identisches Profil aus demselben Markt.
AccessRights ist None: Der Indikator platziert keine Orders, ändert nichts und liest keine Kontodaten.
SUPPORT
Dokumentation, die jeden Parameter, überraschende Einstellungen und eine Fehlerbehebung abdeckt, wird mit dem Produkt geliefert. Fragen sind über den Diskussions-Tab willkommen; ein nützlicher Bericht nennt das Symbol, den Broker, den Zeitrahmen, die cTrader-Version und die von den Standardwerten abweichenden Einstellungen.
Trading beinhaltet Risiken. Vergangene Leistungen garantieren keine zukünftigen Ergebnisse.
Zusammenfassung
Users can customize the lookback period (50 to 2000 bars), profile resolution (50 to 400 levels), display mode (side by side, stacked, split), profile width, and volume filtering. The profile updates dynamically on every tick of the forming bar. It supports any timeframe and instruments with volume data, including tick volume for forex and real exchange volume for some CFDs. The indicator is intended for traders familiar with volume profiles seeking detailed buying and selling pressure insights on a fixed grid rather than session-based profiles. A trial version is available with full features restricted to EURUSD.