Beschreibung
Robuster kumulativer Delta- und Ungleichgewichtsindikator.
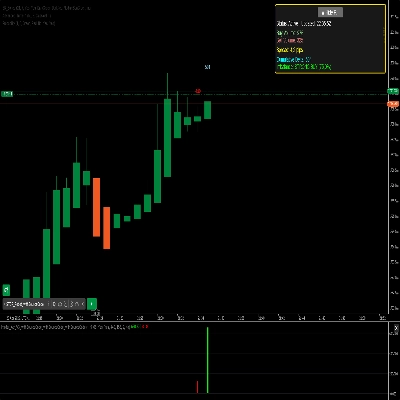
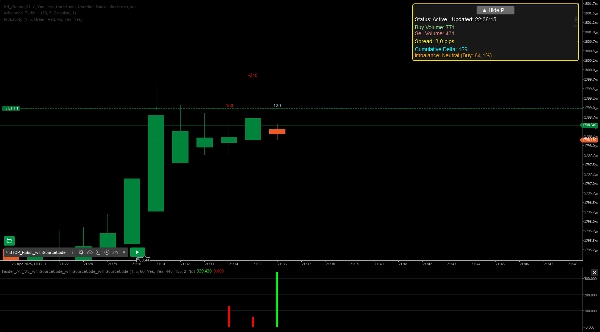
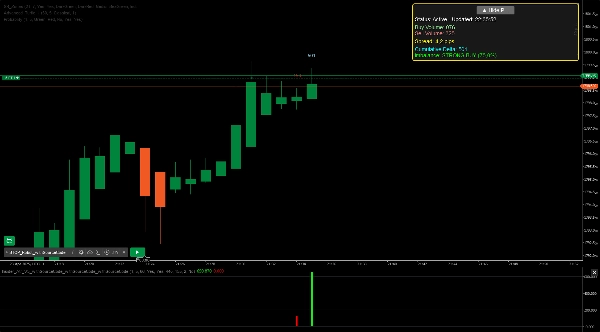
Insider ist ein robuster cTrader-Indikator, der entwickelt wurde, um Markttiefendaten zu analysieren und Kauf- und Verkaufsungleichgewichte in Echtzeit hervorzuheben. Er bietet klare visuelle Rückmeldungen im Chart und zeigt wichtige Kennzahlen wie Kauf-/Verkaufsvolumen, kumulatives Delta und Ungleichgewichtsintensität durch Histogramme und ein anpassbares Dashboard an. Passen Sie ihn an Ihren Handelsstil mit einstellbaren Parametern an, darunter Anzeigezeitraum, Tiefenstufen (1-10) und Schwellenwert für Volumenungleichgewicht (50-95%). Weitere Funktionen umfassen optionale Warnungen bei starken Ungleichgewichten, Filter für Handelszeiten und ein größenveränderbares Panel für verbesserte Benutzerfreundlichkeit. Ideal für Daytrader und Swingtrader bietet dieser Indikator wertvolle Einblicke in die Marktstimmung und potenzielle Kursbewegungen.
Zusammenfassung
Kundenbewertungen
5 | 100 % | |
4 | 0 % | |
3 | 0 % | |
2 | 0 % | |
1 | 0 % |