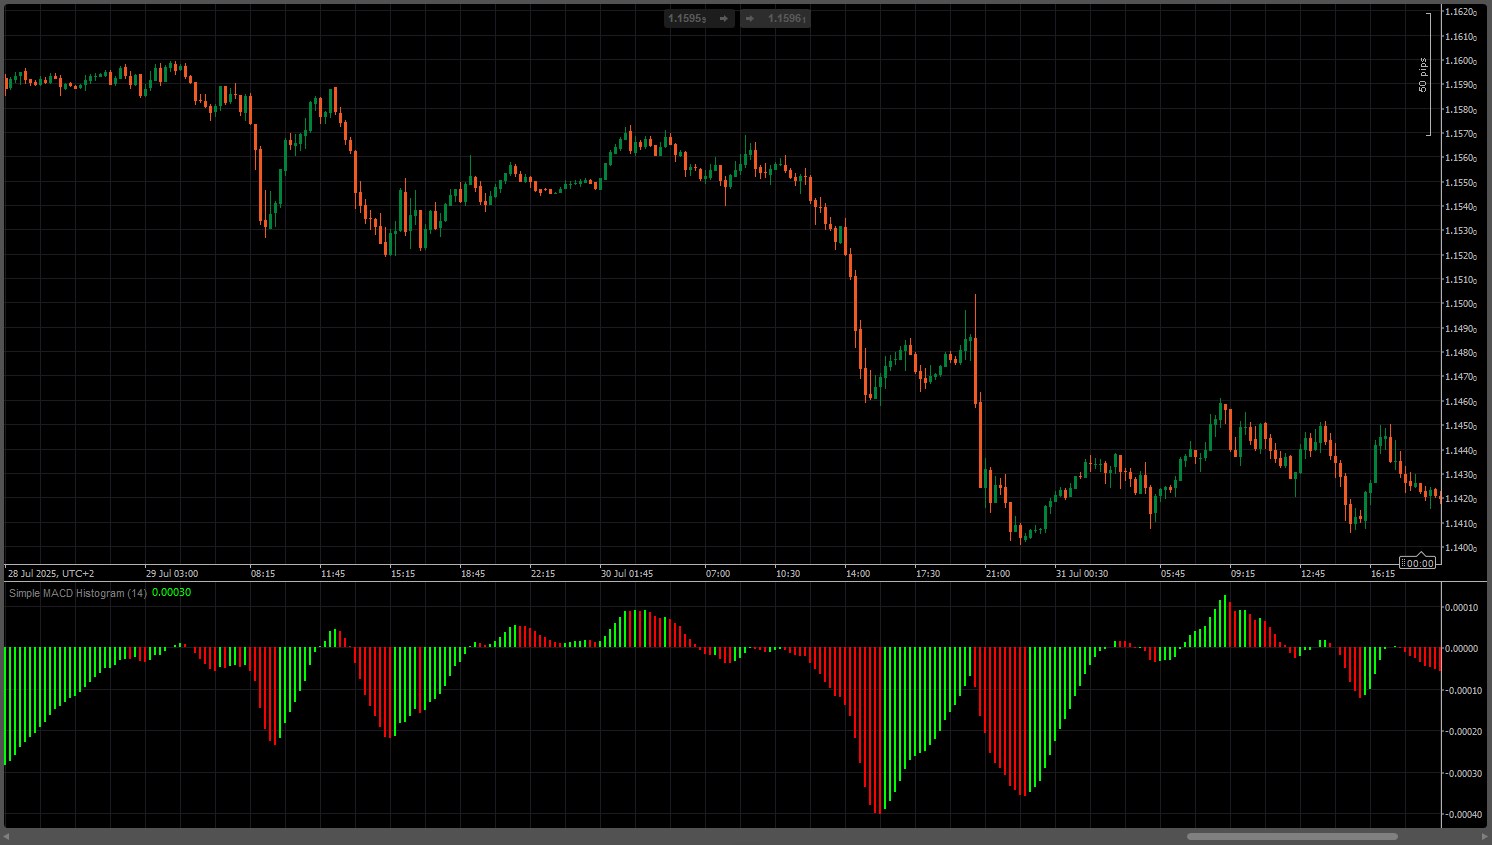

This custom MACD Histogram indicator displays the MACD histogram with enhanced visual clarity styling. The indicator uses a fast EMA period of 14, automatically calculates the slow EMA as fast plus 2 (16). The indicator features highly contrasted color-coding for instant trend recognition: bright green bars indicate rising momentum (bullish), while red bars show falling momentum (bearish). The histogram bars extend symmetrically from a center zero line, creating an intuitive visual representation where green signals buy pressure and red signals sell pressure. This visualization style provides clear, unambiguous momentum signals and helps identify potential trend reversals and momentum shifts in price action.
You may also like


Indicator
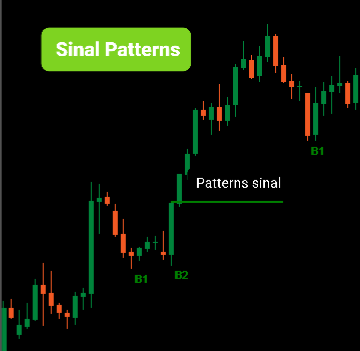
breakout
session indicator
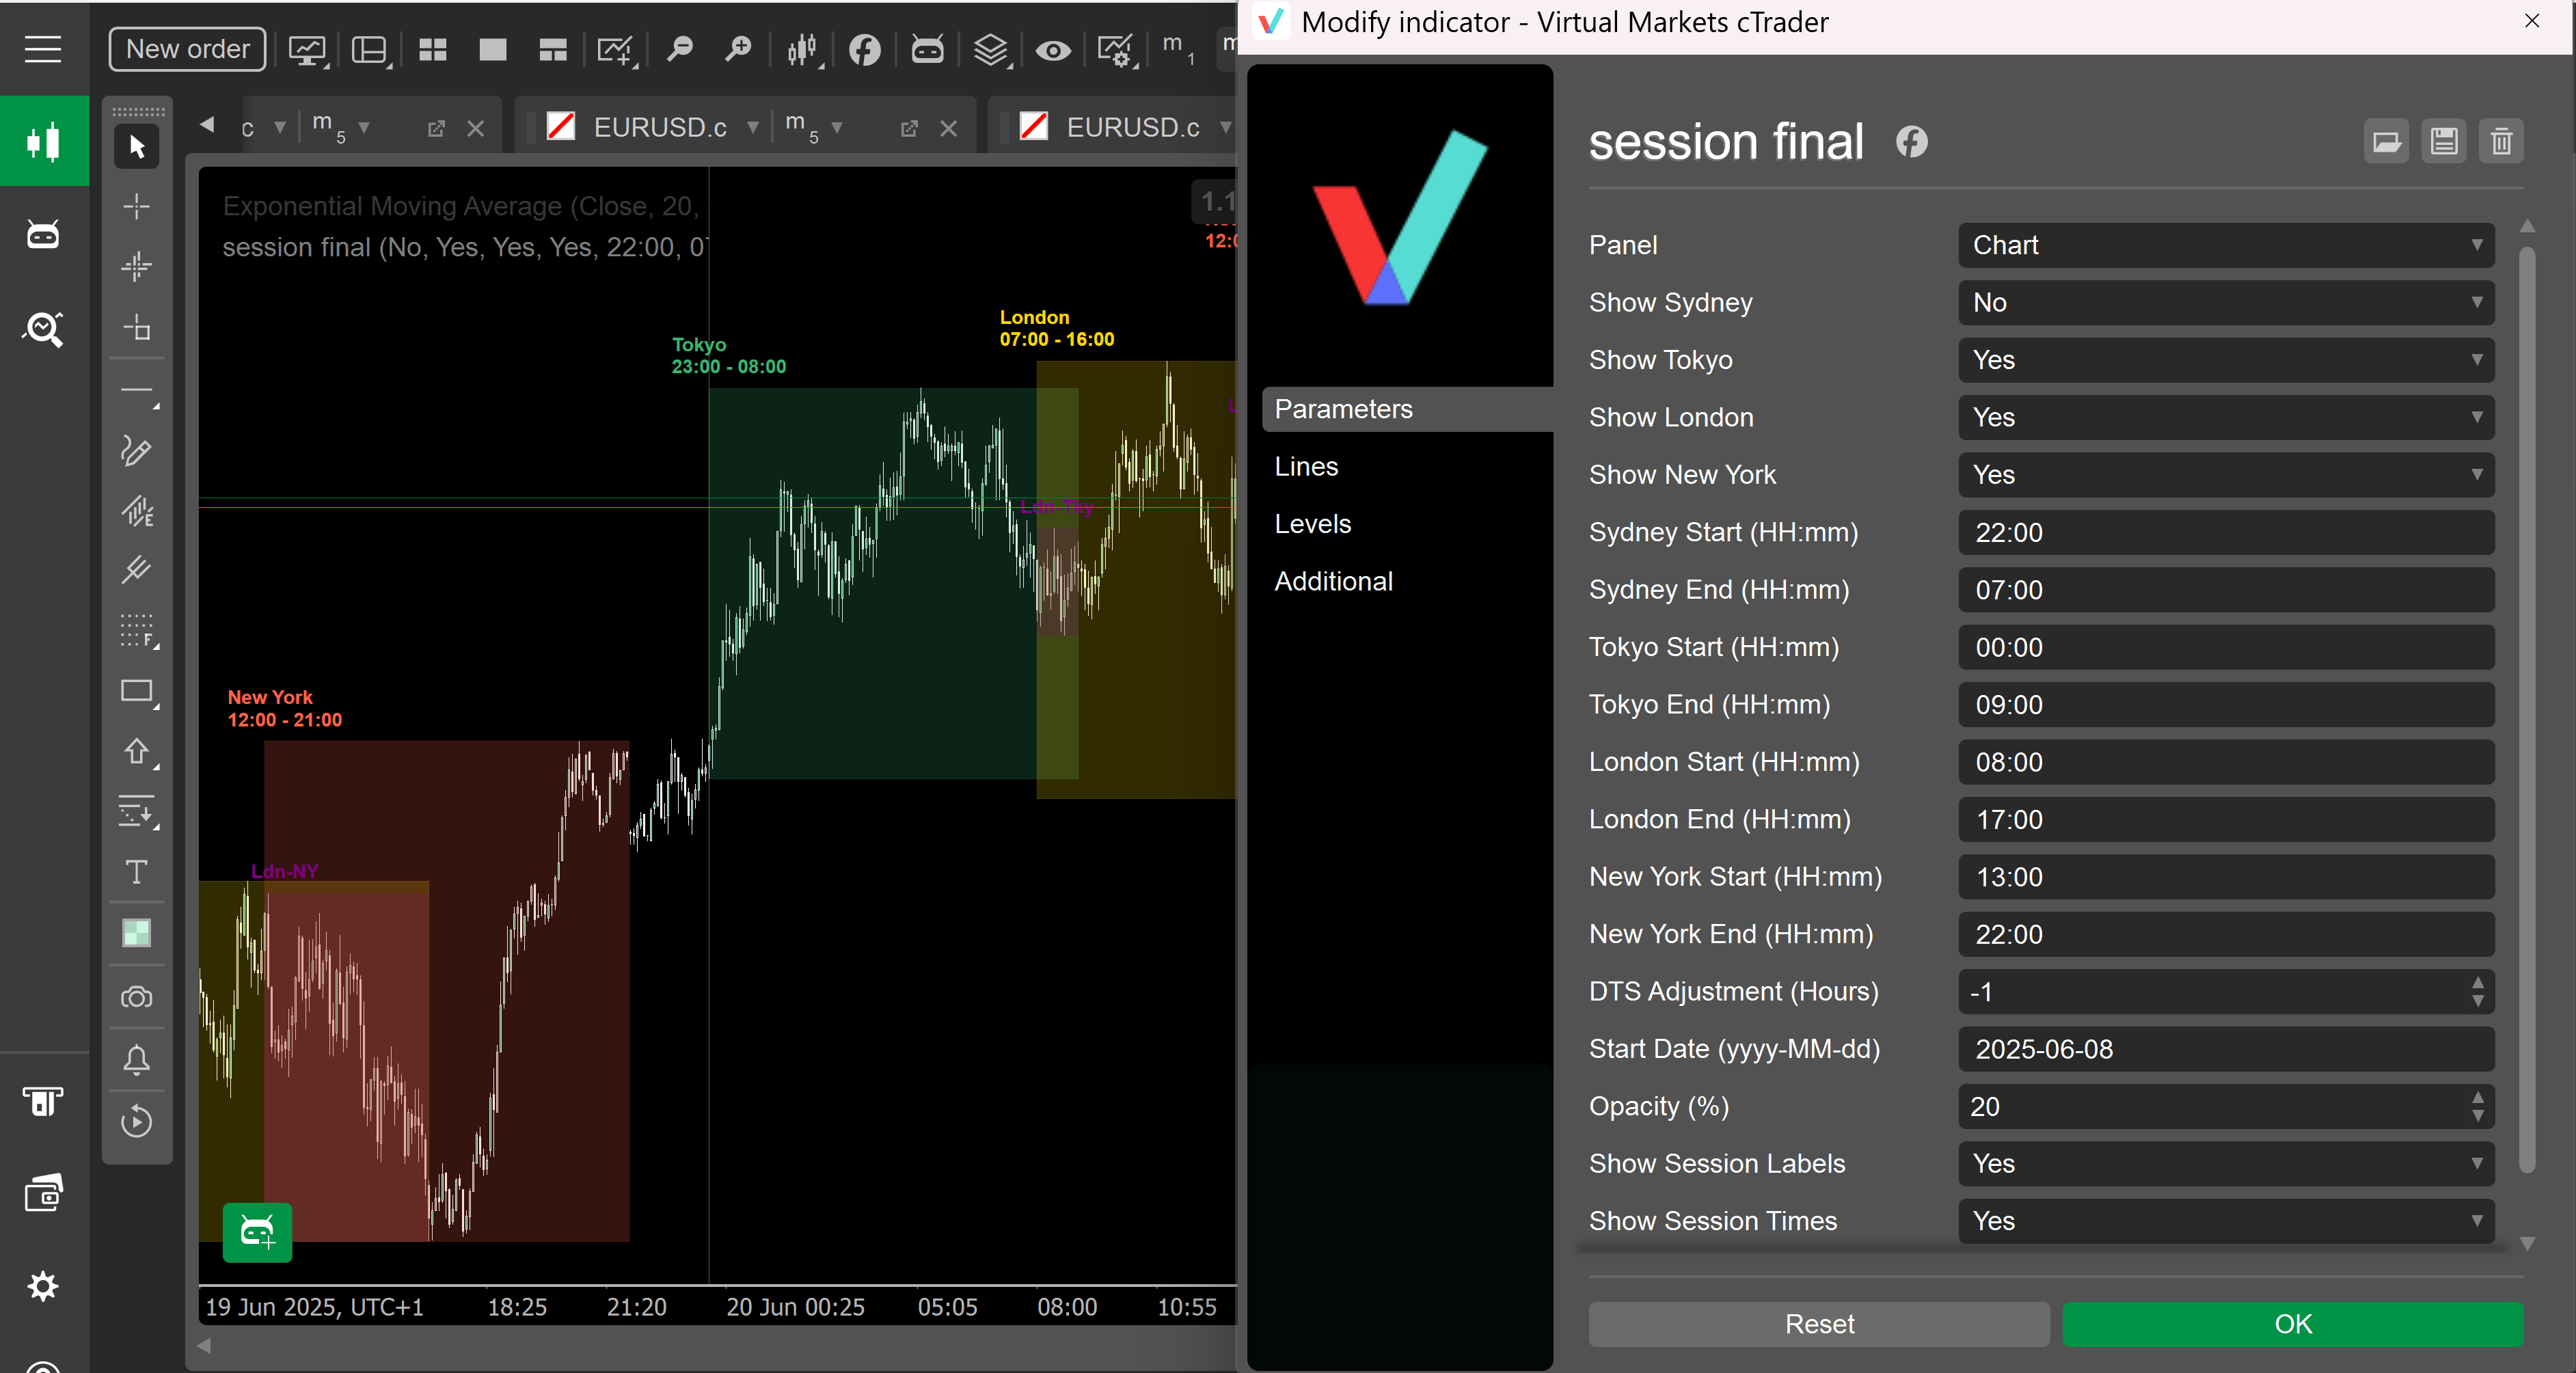
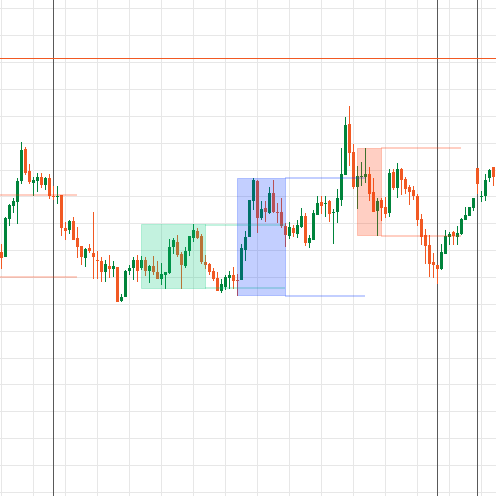
📈 Trading Sessions Indicator — London, New York & Tokyo Visualize Key Market Sessions + High/Low Levels with Precision
Indicator
macd
NTNPICLL
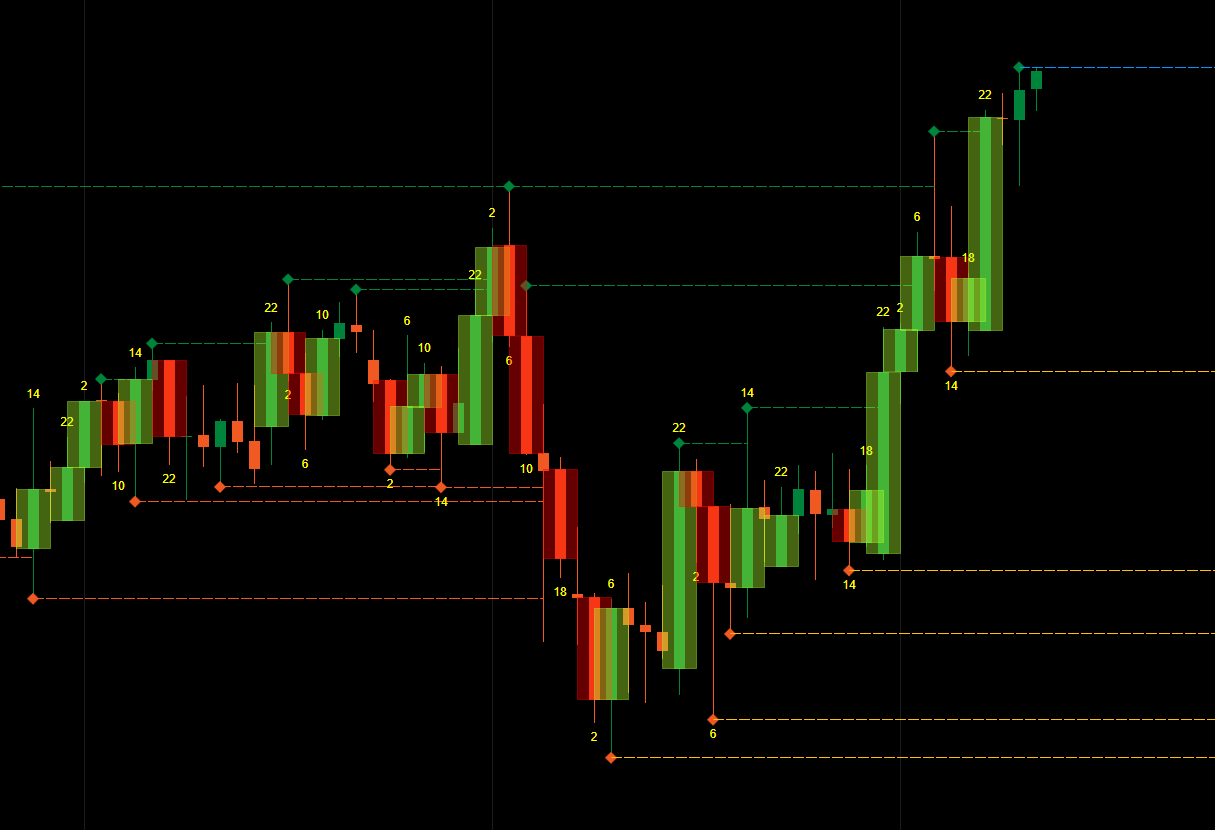
NTNPICLL is a tool to check the best trading hours for the assets and also includes the highest and lowest point

!["[Stellar Strategies] Moving Averages Combined 1.0" logo](https://market-prod-23f4d22-e289.s3.amazonaws.com/b4cd360c-5f3c-4902-b2e1-6b86da1199bb_Gemini_Generated_Image_nl1erpnl1erpnl1e.jpg)