Indicator
NAS100
Breakout
XAUUSD
Commodities
Forex
Signal
EURUSD
GBPUSD
BTCUSD
Indices
Stocks
Supertrend
Crypto
USDJPY
Scalping
Daily Weekly Monthly - Highs & Lows
29/09/2025
2
Desktop
Since 11/09/2024
Sales
4
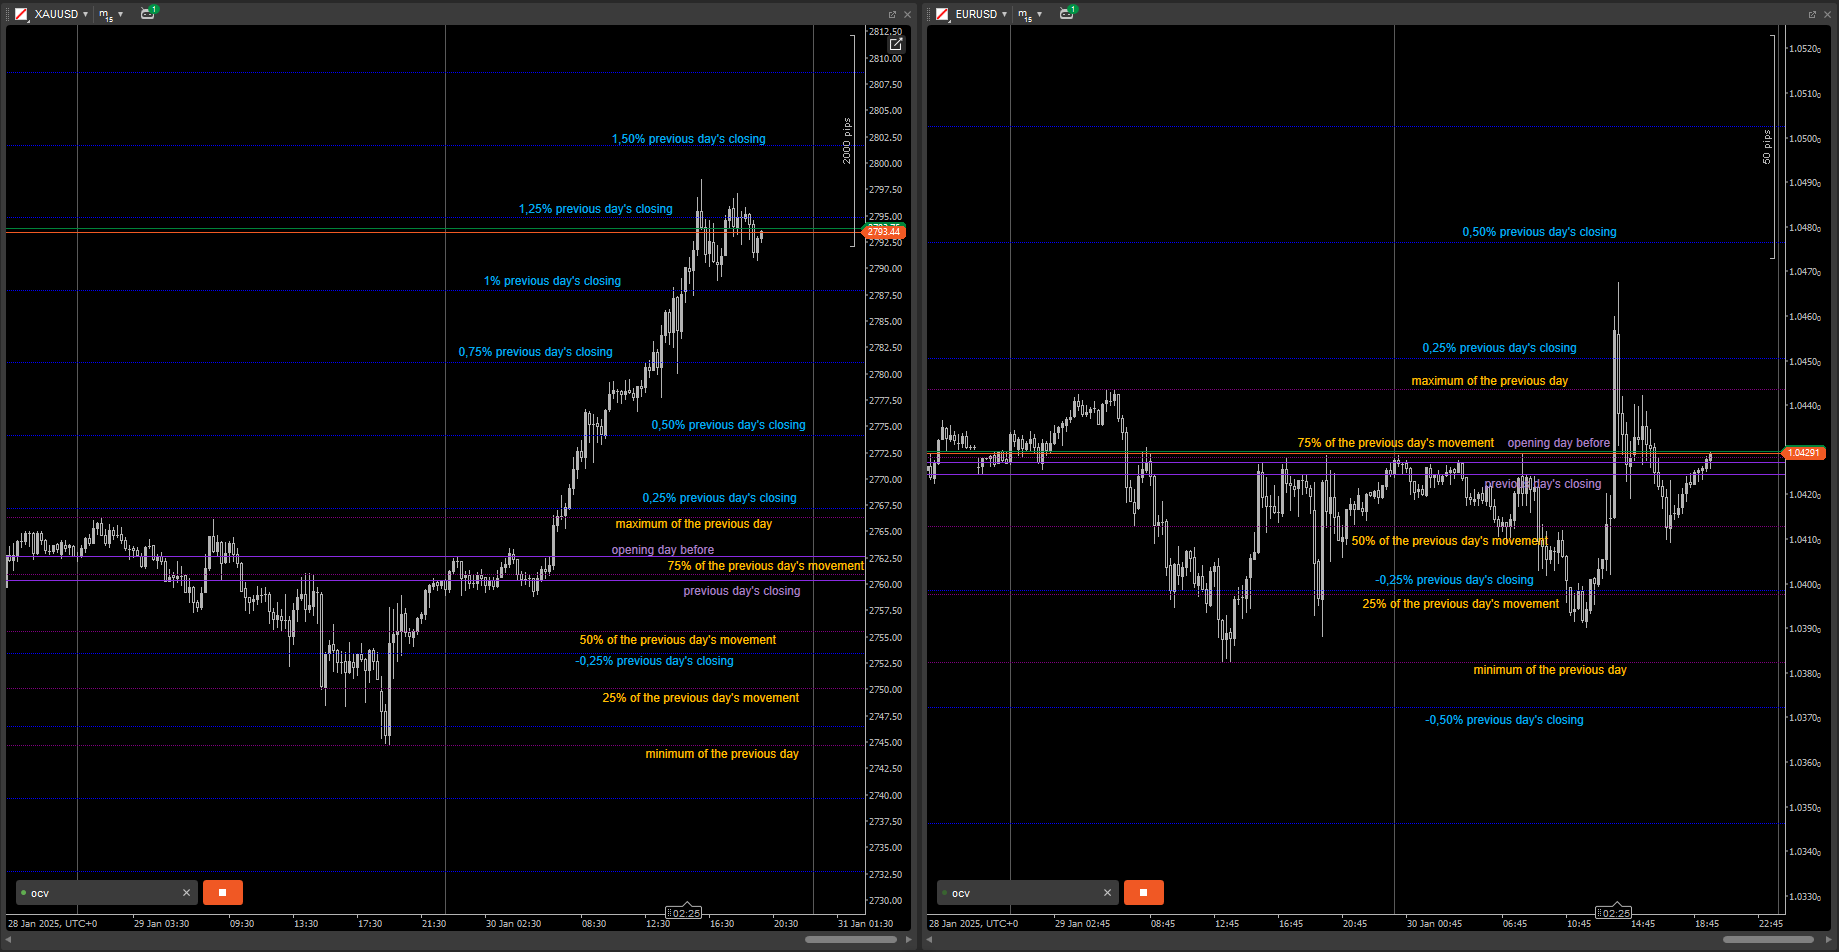
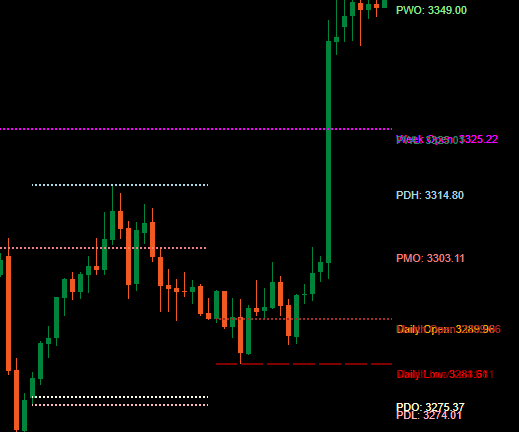
Daily/Weekly/Monthly - Highs & Lows Indicator:
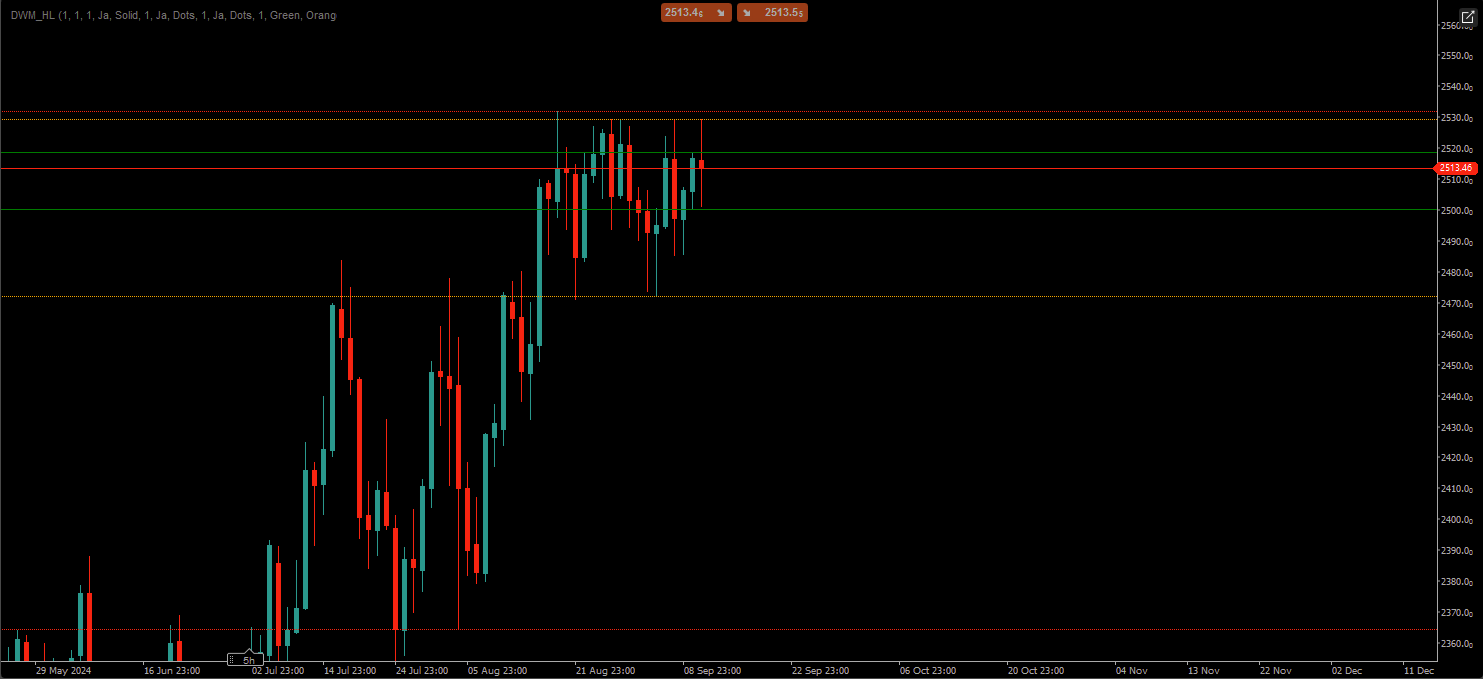
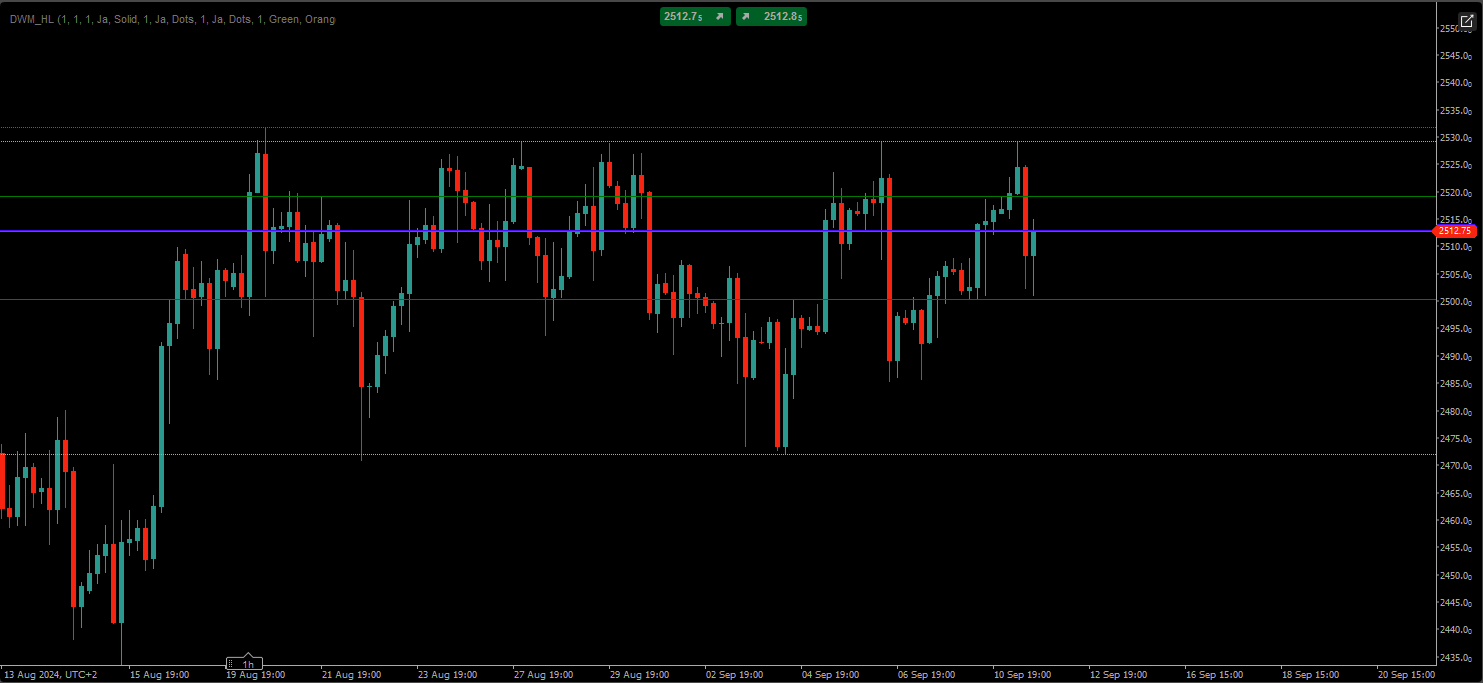
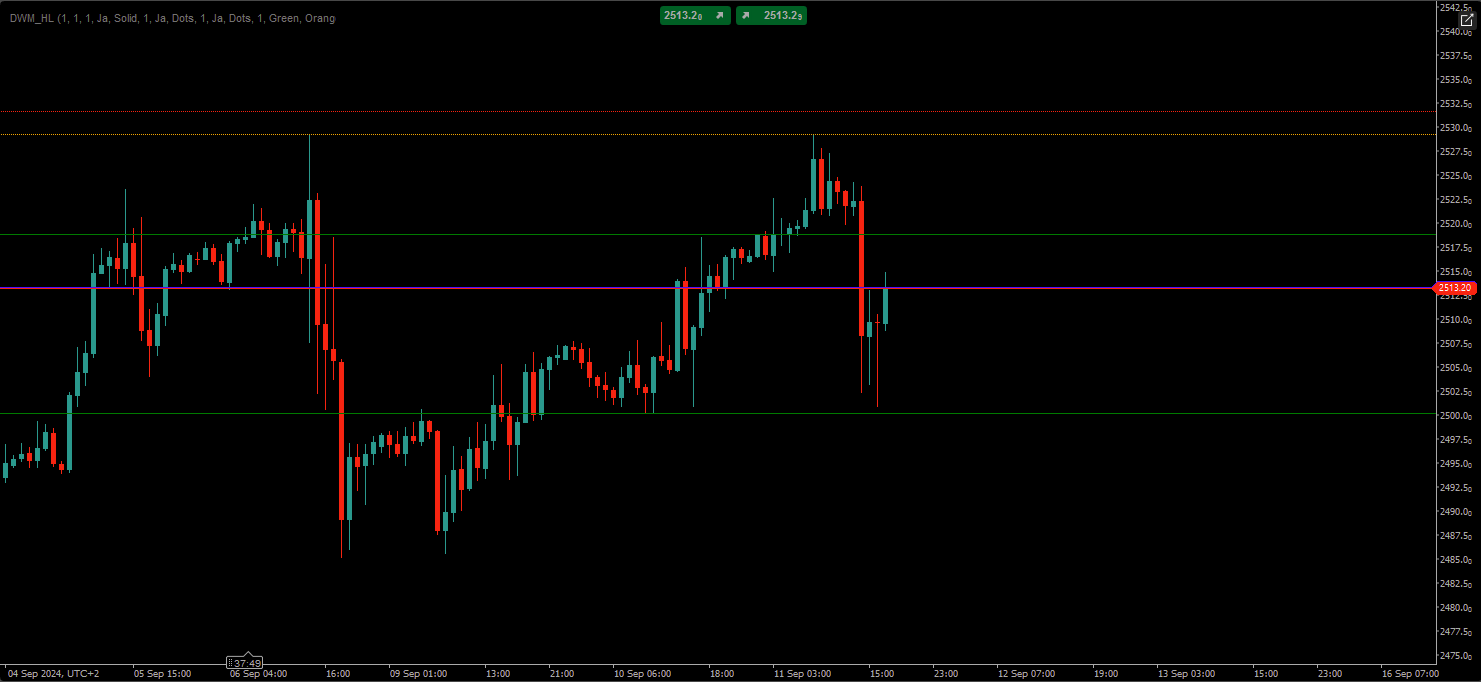
This user-friendly indicator shows the high and low points of the last days, weeks, and months on your chart. In addition to the regular lines for the most recent period, you can add optional lines for previous days, weeks, and months, with full customization of colors and styles to suit your preference. It offers a clear visual representation of crucial support and resistance levels, helping you make informed trading decisions.
Features:
- Displays the highs and lows of previous days, weeks, and months.
- Customizable line colors and styles for additional periods.
- Simple, clean design perfect for traders who prefer an uncluttered chart layout.
- Supports multiple time frames and provides valuable insights into historical price levels.
This indicator is ideal for traders looking to quickly identify important market levels while maintaining a clean and organized chart view.
More from this author

You may also like
!["[Stellar Strategies] MARSI Signal Plotter" logo](https://market-prod-23f4d22-e289.s3.amazonaws.com/ce01bd9f-8907-48d9-a68d-7c0bde6b9704_4aDZjo80P5.png)


!["[Hamster-Coder] Pivot Points (Demo)" logo](https://market-prod-23f4d22-e289.s3.amazonaws.com/6a1481e2-bd00-4037-bcf0-33495594f95a_Icon300.jpg)