
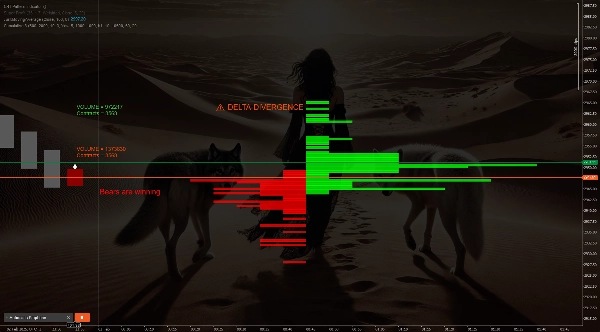
Cumulative Delta Candles + VolumeProfile
Indicator
2.15K downloads
Version 1.0, Feb 2025
Windows, Mac
4.5
Reviews: 2
Description
Cumulative delta candles, Volume profile, delta divergence warning + buy sell signals , have fun
Summary
AI summary
This indicator combines cumulative delta candles with volume profile analysis to provide insights into market activity. It features delta divergence warnings and generates buy and sell signals based on the interplay of order flow and volume distribution. The tool is designed to assist traders in identifying potential market turning points by highlighting imbalances between buying and selling pressure. It integrates these elements into a single visual interface for use on trading charts.
Indicator profile
Customer reviews
4.5
Reviews: 2
5 | 50 % | |
4 | 50 % | |
3 | 0 % | |
2 | 0 % | |
1 | 0 % |
Customer reviews
July 9, 2025
Pros: Combines cumulative delta and volume profile for precise liquidity and order flow analysis. Clear visualization, flexible settings. Stable performance. Cons: No alerts or tooltips. No history of previous profiles. Requires confirmation from additional tools for trading decisions.
April 21, 2025
Discussion
FAQ
Products available through cTrader Store, including trading bots, indicators and plugins, are provided by third-party developers and made available for informational and technical access purposes only. cTrader Store is not a broker and does not provide investment advice, personal recommendations or any guarantee of future performance.


Price
Since 09/01/2025
11.78K
Free installs