"CursorbyteAutoFib v2" 로고
CursorbyteAutoFib v2
"CursorbyteAutoFib v2" 업로드된 이미지
가입일 31/10/2024
44
판매
1.65K
무료 설치

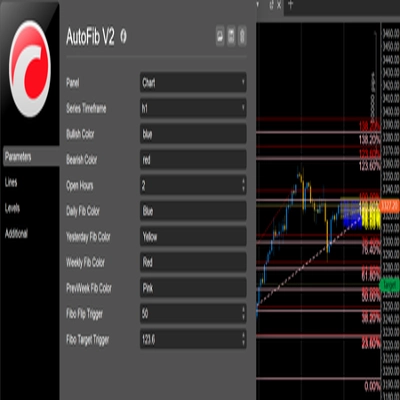
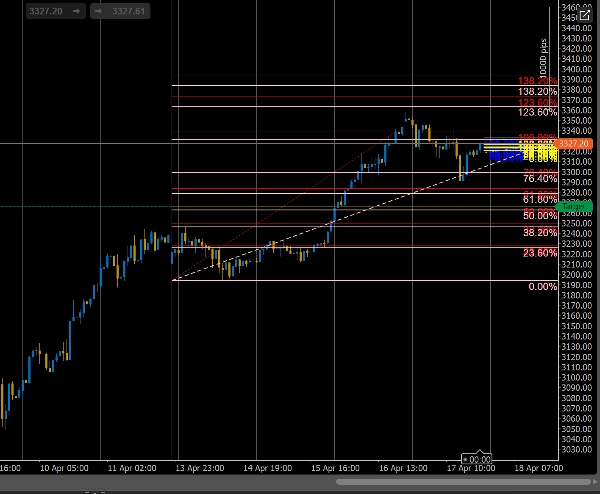
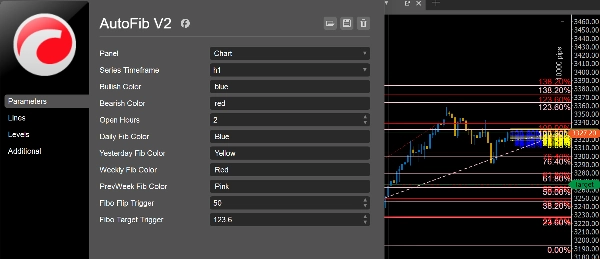
This cTrader indicator automatically draws Fibonacci retracement and extension levels based on recent price swings. It helps traders identify potential support, resistance, and target zones, making it easier to plan entries, exits, and stop-loss placements with precision.

Indicator profile
0.0
리뷰: 0
고객 리뷰
이 상품에 대한 리뷰가 아직 없습니다. 이미 사용해 보셨나요? 다른 사람들에게 가장 먼저 소개해 주세요!
Products available through cTrader Store, including trading bots, indicators and plugins, are provided by third-party developers and made available for informational and technical access purposes only. cTrader Store is not a broker and does not provide investment advice, personal recommendations or any guarantee of future performance.

이 작성자의 상품 더 보기

Auto-detect support and resistance & trendlines, highlight pullbacks/BOS retests, and filter with candle confirmation.
Visual calendar with daily PnL, trades, win rate, profit factor, and performance insights.
Visualize trading volume by price within any range, highlight POC and key value areas.
Auto-detect support and resistance & trendlines, highlight pullbacks/BOS retests, and filter with candle confirmation.
Trade with clarity. Protect your capital. Let Risk Manager enforce the rules.
0%
최대 낙폭
Apply Stop Loss and Take Profit to all positions and pending orders in one click.
A professional trading utility that displays real-time daily range statistics directly on your chart
Automatically plots Daily and Weekly Fibonacci retracements with smart redraw and session control.

좋아하실 만한 다른 항목

Professional fixed-range Volume Profile for cTrader with POC & Value Area per timeframe period.
Order Block PRO — Smart Institutional Zone Detector
SSL Channel with MTF modes, timeframe pattern, ATR envelope, and bar coloring.
🎯Smart Signals : Auto Buy/Sell alerts with dynamic TP/SL algorithm. 💡
Gann Pivot Vision is an innovative analytical tool that combines classic pivot reversal levels and Gann geometry
🎁 21-Day Full Trial — All Features Unlocked. No limits, no credit card.
The Improved ADXVMA is a custom trend-following indicator. It plots a smoothed Weighted Moving Average trend.
The FAMA-MAMA Indicator is a powerful, adaptive trend-following tool designed for professional and algorithmic traders.
Engulfing Candle Indicator Pro
Fractal MSS with 4H Bias is a smart market-structure indicator designed to detect: Market Structure Shifts (MSS)
Get the exact SuperTrend experience from TV, now perfectly rebuilt for cTrader
The Market Sessions indicator is a popular tool for visually representing global trading sessions on a price chart.
Supply and demand zones. They're important. Here's a free version to get you started!
Enhance trading with ATR Bands! Visualize market volatility using dynamic upper and lower ATR bands for precise decision
Comprehensive time session indicator
Visual Trend Momentum is a MA/ATR/Volume trend tool. Visual signals for strong trends & reversals. Customizable. 📈📉
📊Zones Supply & Demand: Identifies key price levels with high volume concentration, marking Supply/Demand Zones & Marke
Plots chosen symbol's close price, candlestick (wick, body) on cTrader chart, supports multiple timeframes.
가입일 31/10/2024
44
판매
1.65K
무료 설치