Indicator
breakout
indices
supertrend
"[CB] Pivot Points Pro" logo
[CB] Pivot Points Pro
0.0
15/09/2025
0
Desktop

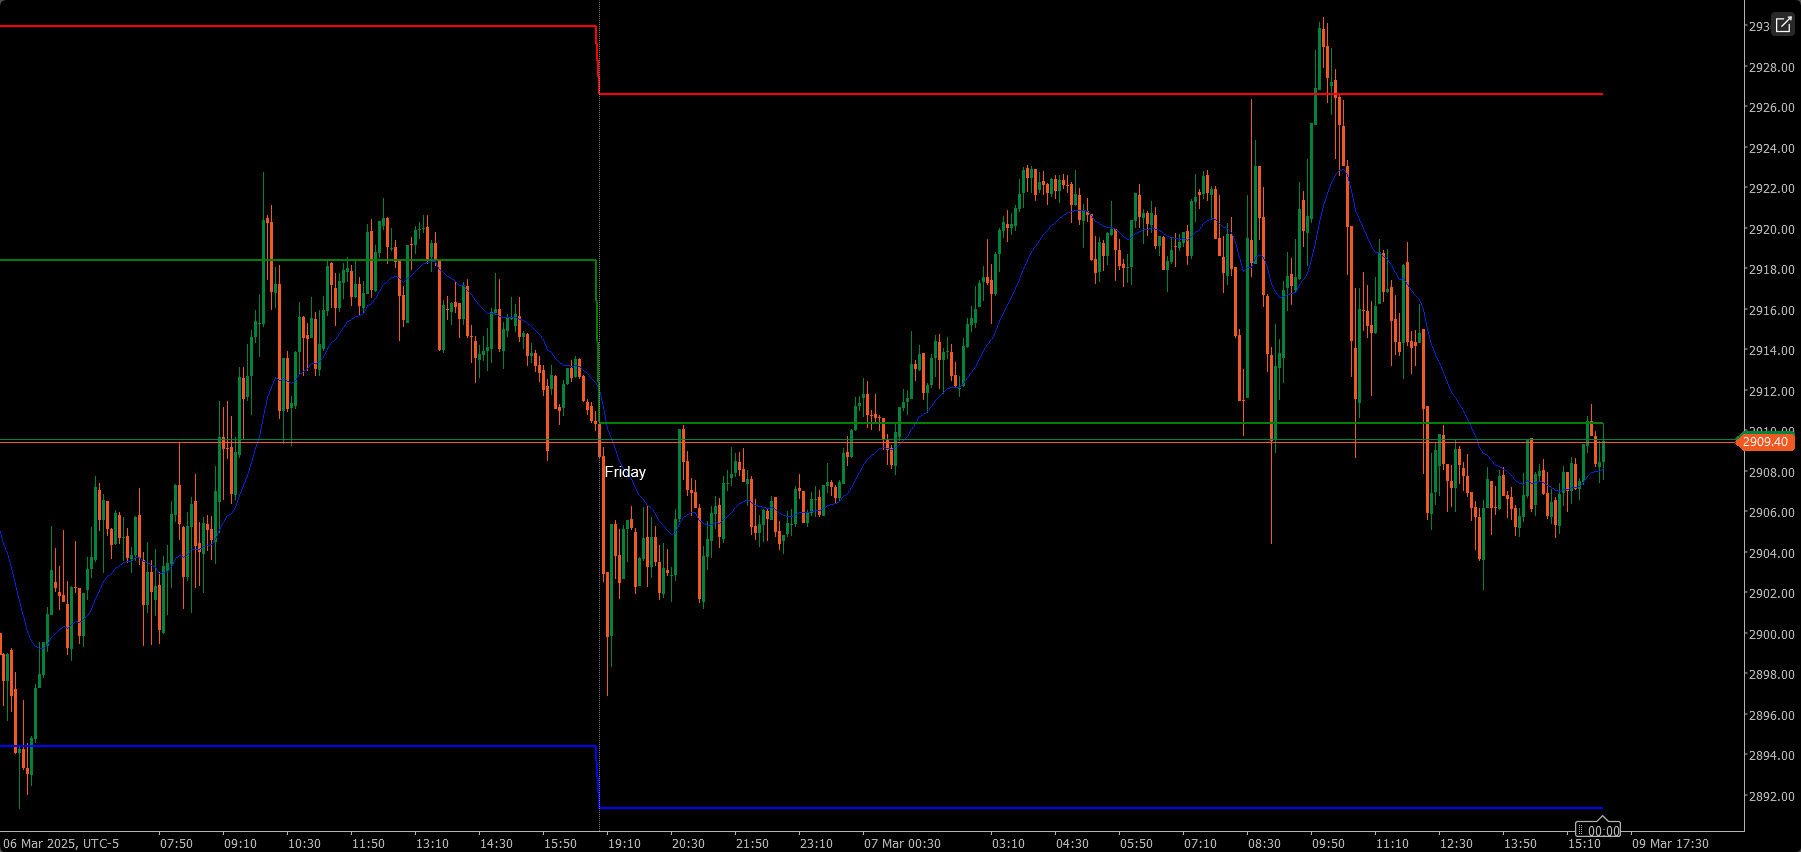
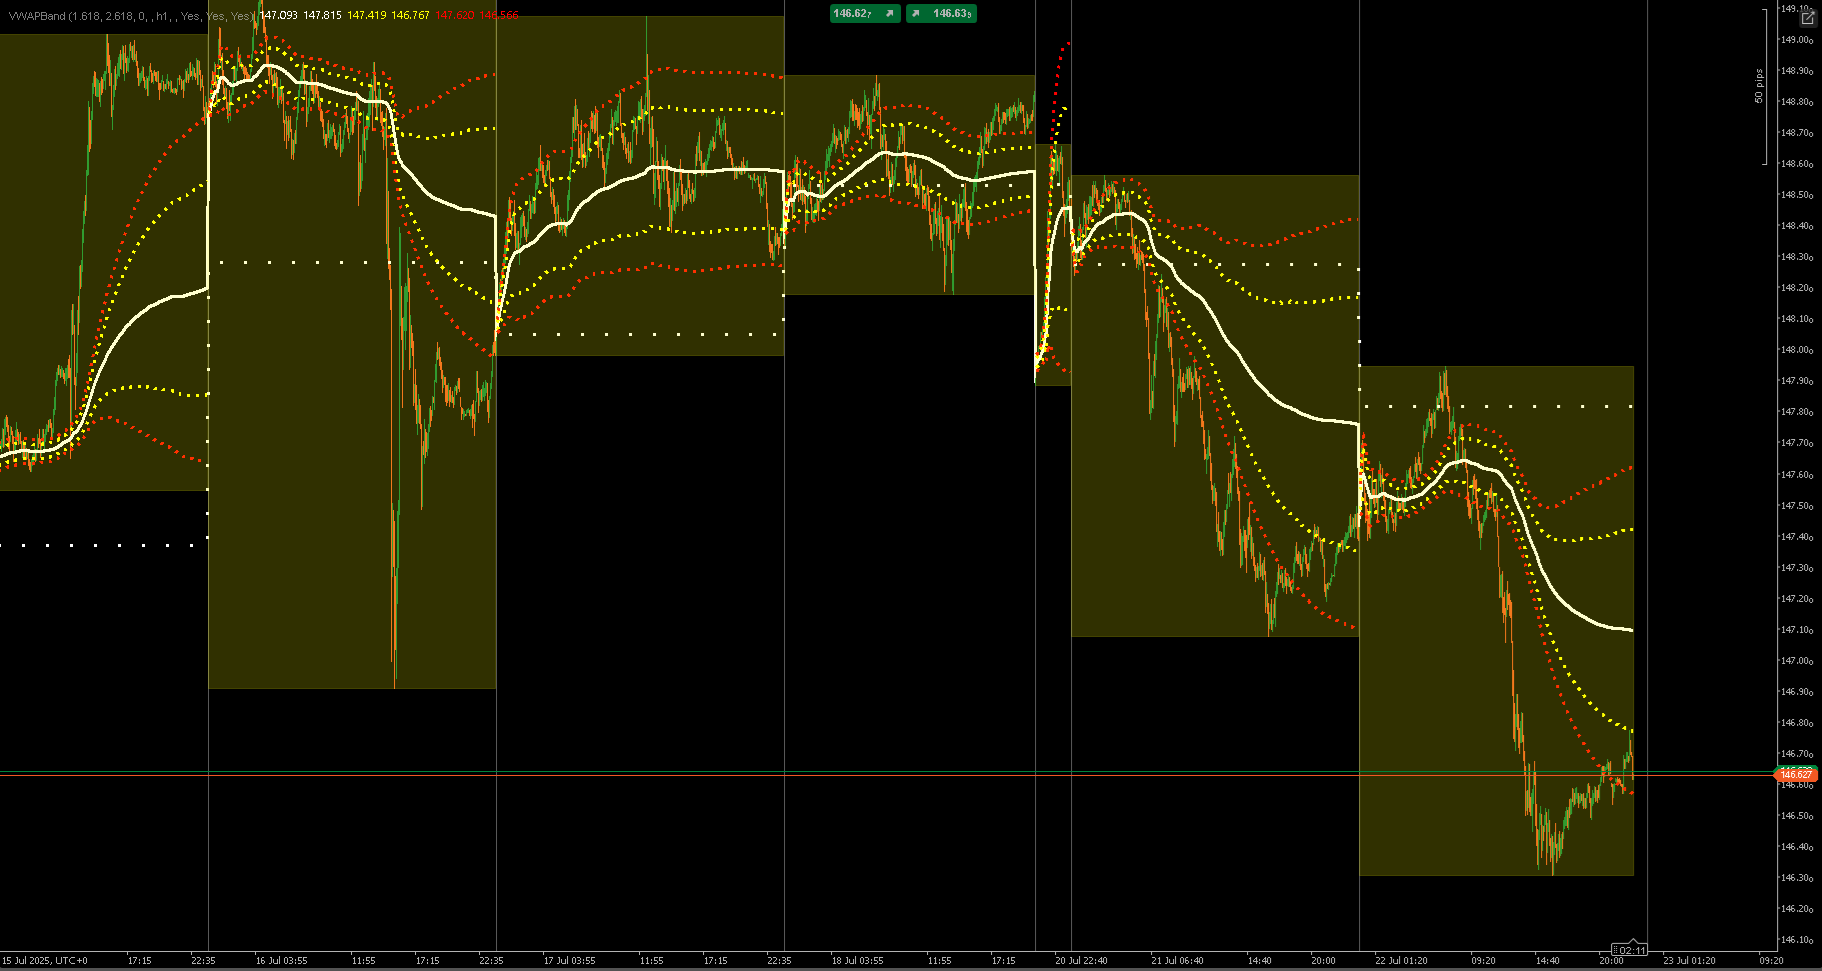
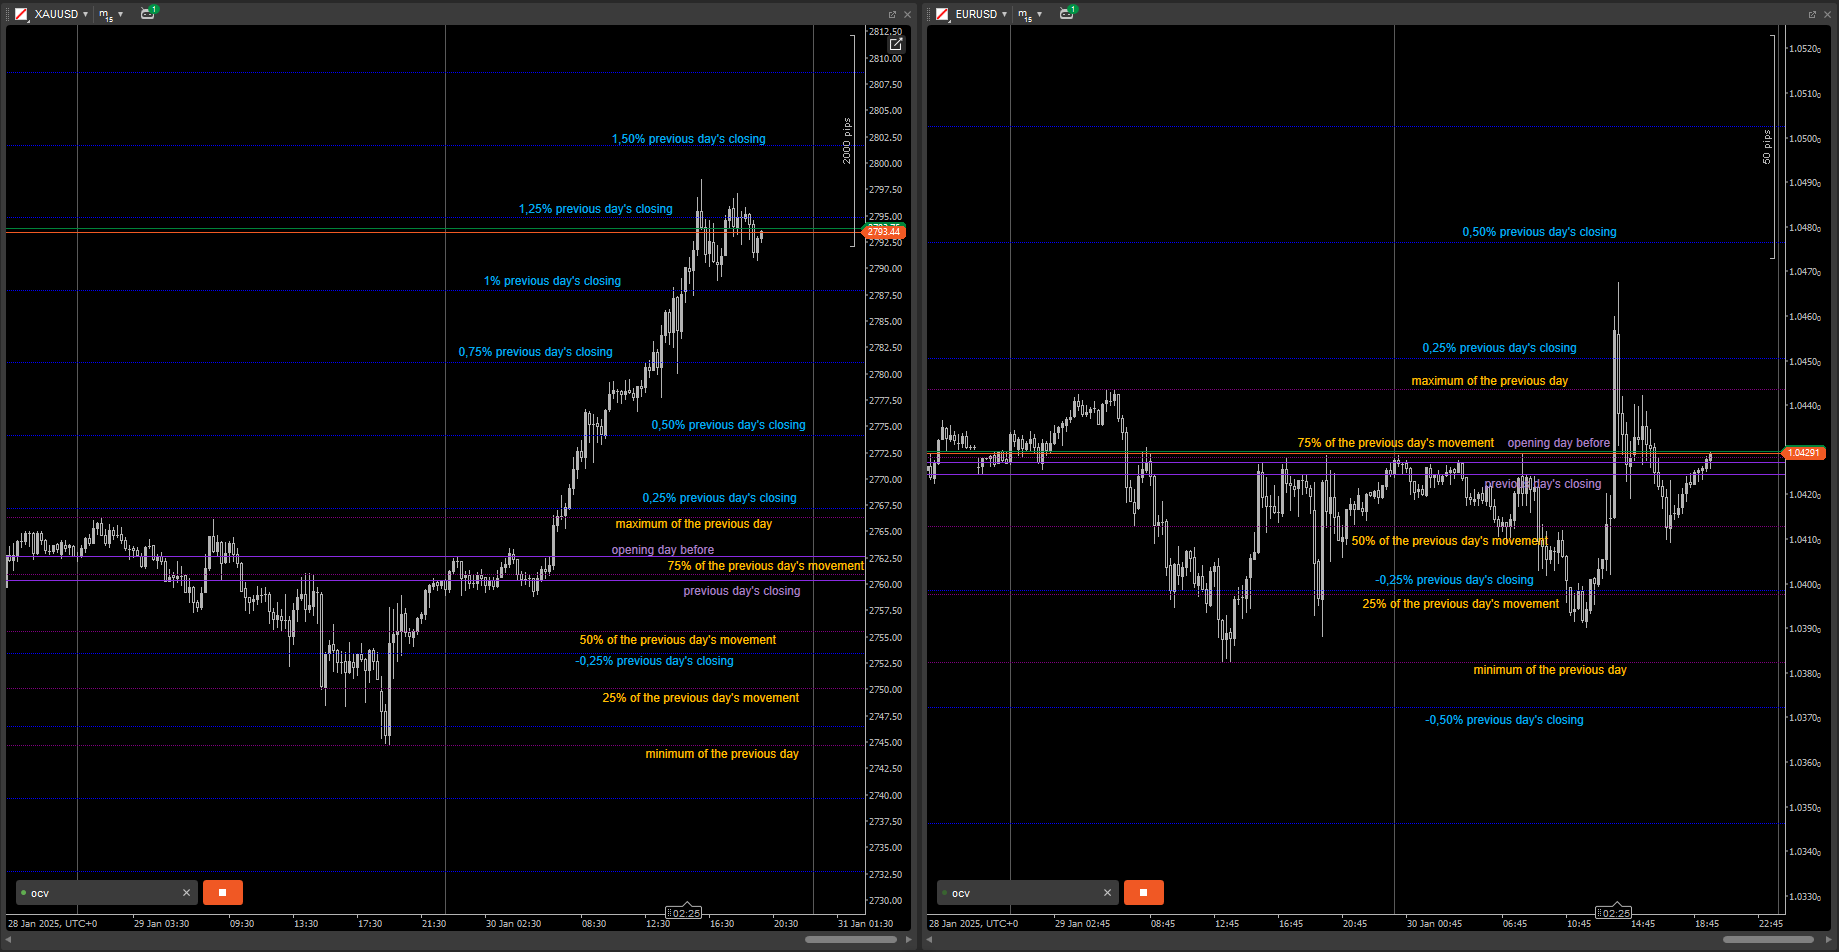
A pivot point is a technical analysis indicator that is used to determine the overall trend of the market using different time frames and it plays the role of identifying support and resistance levels. The most popular timeframe for a pivot point indicator is daily.


How to Adjust the Indicator

You can easily turn off the support and resistance levels 1,2 and 3 so you can just see the main pivot point, this is dome in the setting Show R/S. The term R/S means resistance and support levels.


Pivot Point Formulas Available

There are a few options for the calculations on where the support and resistance levels are shown, this indicator allows the choice of 3.

  • Standard (Classical)
  • Fibonacci
  • Woodie


Multi-Timeframe Options

The indicator also has the option to show different timeframe pivot points on your chart which may be showing a different timeframe, the available timeframes are as follows:

  • Current chart timeframe
  • 1-hour
  • 4-hour
  • Daily
  • Weekly
  • Monthly


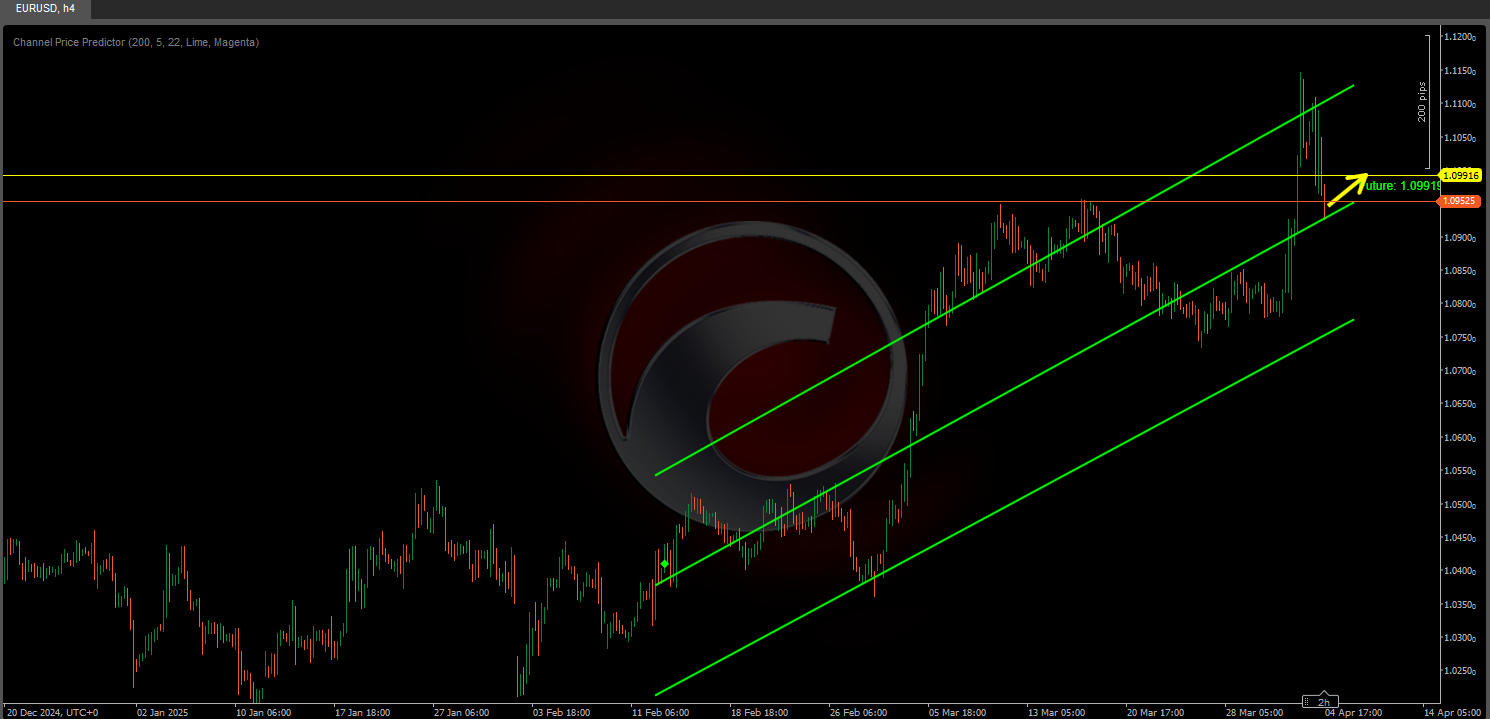
How to Trade With Indicator

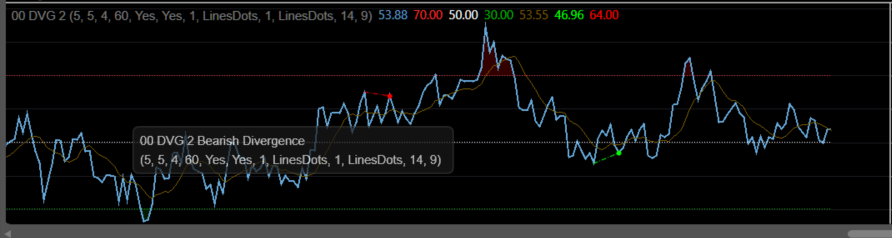
An example of how to trade with this indicator is shown below:

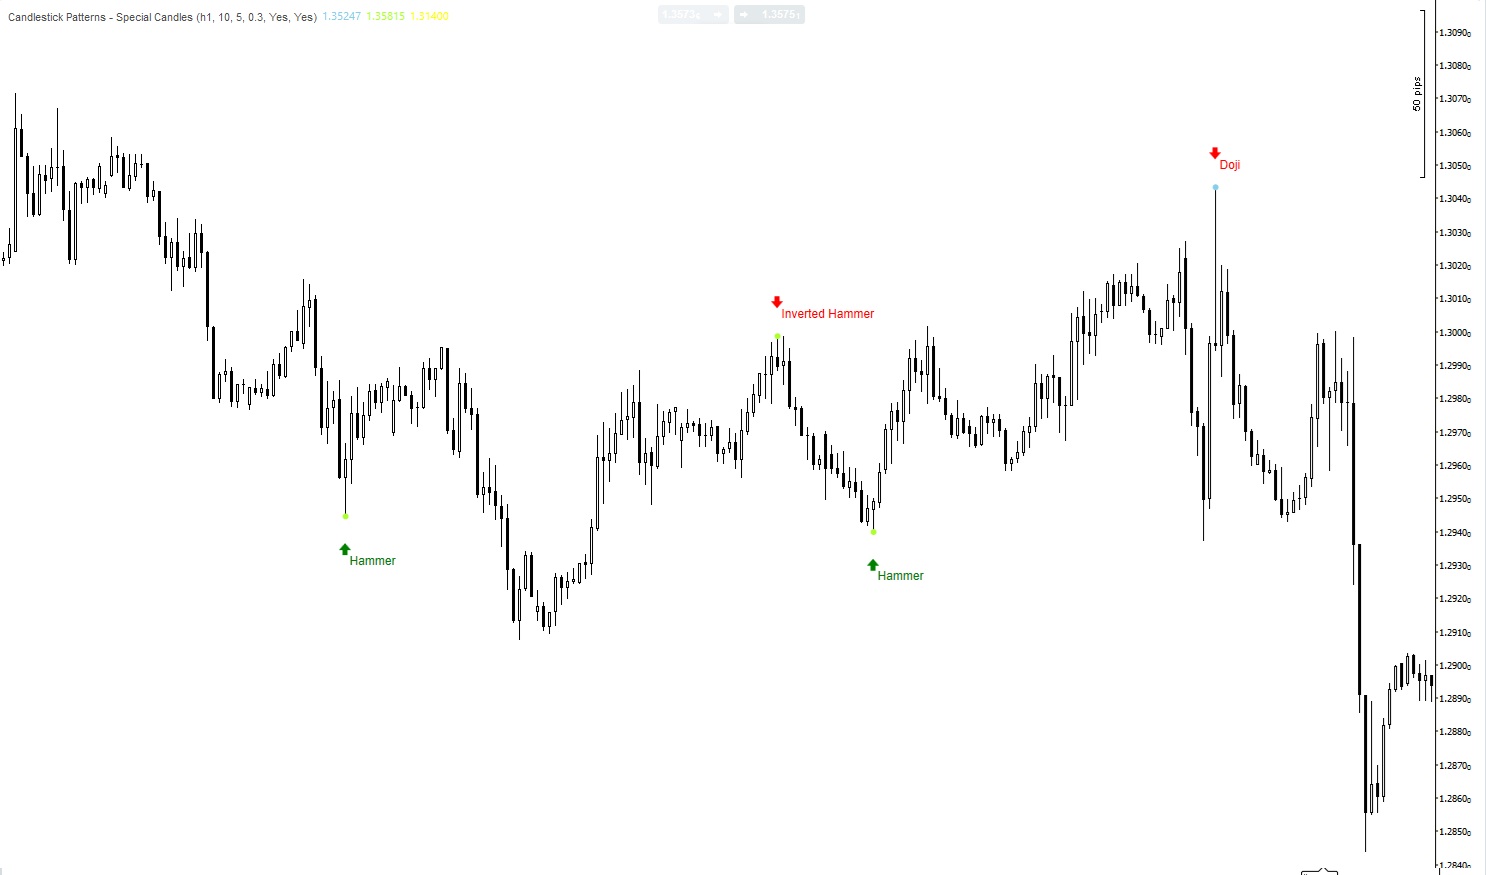
  1. Entry 1: reject by R1 level and there is an engulfing candle
  2. Entry 2: break out the pivot point and retest again
  3. Take Profit: reach the S2 level and this is also the bottom of the range
More from this author
cBot
forex
indices
crypto
+1
Risk And Reward Management
The cTrader Risk & Reward management tool can easily help you to set the risk vs reward values
You may also like
OHLC PRO by LudwigICT
OHLC PRO – Advanced Session & Market Structure Tool
xhobaniFX_ADR-Lines
xhobaniFX_ADR-Lines: Average Daily Range Horizontal Lines
Indicator
forex
indices
vwap
+11
FBX VWAP
FBX VWAP Anchored — Professional VWAP
Indicator
forex
indices
crypto
+1
Bullet Chart Trend
Unique Pyramid Design , Clear Price Action Trend
LDE - Market Sessions
🇫🇷 Visualisez vos sessions de marché et OPR d'un coup d’œil 🇬🇧 Visualize your market sessions & OPR at a glance !
Daily Sessions HighLow Helper
Shows daily and sessions highs / lows and session boxes, everything configurable
Order Flow Ticks v2.0
Indicator
indices
rsi
StochasticRSI
Stochastic RSI (StochRSI) is a technical indicator used to measure the strength and weakness of the RSI.
Indicator
forex
commodities
stocks
buy sell
SmartSignal Pro: Precise BUY/SELL signals to profit in any market. Trade like a pro! 🚀
Indicator
breakout
atr
signal
UT Bot
ATR-based trend following tool with trailing stop logic. Highlights crossovers using clean up/down bands and bar colour.
IR Ichimoku Macd
this indicaotr show distance between Tenkan to Kijun, Close to Kijun and Close to Tenkan 
ADVANCED ICT + ADR + AWR SUITE PRO
ADVANCED ICT + ADR + AWR SUITE PRO (The Ultimate All-in-One Toolkit for Price Action Traders)
Indicator
forex
prop
MM-Symbol Info (Pro)
NEW - PNLs as % - daily, weekly, monthly, or yearly & Spread, Time To Close, PNL Alerts, custom Bid / Ask lines
IVB 2.0
IVB 2.0 is an indicator that works on the strategy of imbalance of the maximum volatility box of indices
Zero Lag Exponential Moving Average
ZLEMA (Zero Lag EMA) is a faster, smoother version of EMA, ideal for capturing quick market shifts and trends.
RT TradingView ATR
Upgrade to ATR-RMA! Experience the precise ATR using Relative Moving Average for accurate volatility analysis in cTrader
Indicator
forex
indices
eurusd
+5
cAlgoBuddy - Ultimate Candlestick Patterns
The ultimate candlestick suite is here to help you detect most of the candlestick patters that exist today.
Indicator
breakout
forex
commodities
+3
MAGIC BLOCK STRATEGY
Block Liquidity,indicator.Block Order, Liquids Stops, Signal Sentiment,signal correction