
Description
Taiz Pro Volume Profile: أداة التحليل النهائية لكشف نوايا السوق
هل سئمت من الاعتماد على مؤشرات متأخرة لا تعطيك الصورة الكاملة؟ مؤشر Taiz Pro Volume Profile ليس مجرد أداة أخرى، بل هو نافذتك لرؤية ما يحدث "خلف الكواليس" في السوق.
على عكس مؤشرات الحجم التقليدية التي تظهر "متى" تم التداول، يكشف هذا المؤشر عن "أين" تم التداول، مما يمنحك ميزة تنافسية حقيقية.
---
· ماذا يقدم لك هذا المؤشر؟
o 📈 تحديد مناطق السيولة العالية: اكتشف المستويات السعرية التي تتركز فيها أكبر أحجام التداول. هذه هي المناطق التي يدافع عنها صناع السوق والمؤسسات الكبرى.
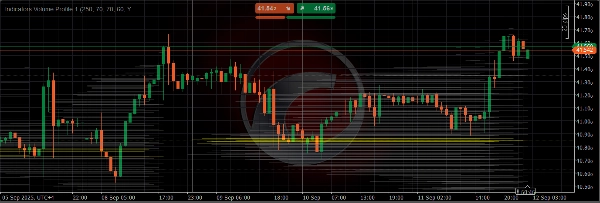
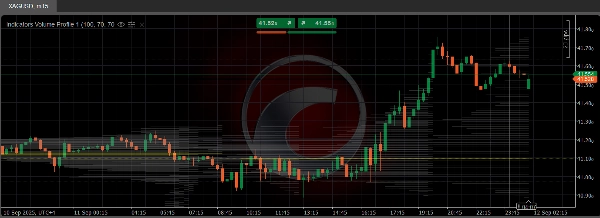
o 🎯 نقطة التحكم (Point of Control - POC):* يعرض لك المؤشر بوضوح (بالخط الأصفر) المستوى السعري الذي حدث عنده أكبر حجم تداول. يعمل هذا المستوى كمغناطيس للسعر ومنطقة دعم أو مقاومة بالغة الأهمية.
o 📊 منطقة القيمة (Value Area - VA): يحدد لك النطاق السعري (باللون الرمادي) الذي تمت فيه 70% من التداولات. التداول فوق هذه المنطقة إشارة صعودية قوية، والتداول أسفلها إشارة هبوطية.
o 💡 قرارات تداول أكثر ذكاءً: استخدم هذه المناطق لتحديد نقاط الدخول بدقة عالية، ووضع أوامر وقف الخسارة في أماكن آمنة، وتحديد أهداف واقعية لجني الأرباح.
---
· لماذا هذا المؤشر أفضل؟
o دقة حسابية فائقة: يستخدم خوارزمية متقدمة لتوزيع الحجم بدقة على كل حركة سعرية، مما يعطي نتيجة أكثر واقعية.
o سهولة الاستخدام: واجهة بسيطة وإعدادات واضحة تتيح لك تخصيص المؤشر ليناسب أسلوب تحليلك.
o أداء مستقر: تم بناء الكود ليكون خفيفًا ومستقرًا، مما يضمن عدم إبطاء منصة cTrader الخاصة بك.
رتقِ بتحليلك الفني إلى المستوى التالي. ابدأ في التداول بناءً على بيانات حقيقية، وليس مجرد تخمينات. حمّل المؤشر الان.
Summary
Key features include:
- High liquidity zones: Identifies price levels with the largest traded volumes, often defended by market makers and institutions.
- Point of Control (POC): Marks the price level with the highest volume using a yellow line, serving as a critical support or resistance area.
- Value Area (VA): Displays the price range where 70% of trading volume occurred, shaded in gray; trading above this area suggests bullish momentum, while below indicates bearish signals.
- Precision trading decisions: Helps users pinpoint entry points, set stop-loss orders safely, and establish realistic profit targets.
The indicator employs an advanced algorithm for accurate volume distribution across price movements, ensuring realistic results. It features a user-friendly interface with customizable settings and is optimized for stable, lightweight performance on the cTrader platform.
Applicable markets include Forex, indices, commodities, stocks, and cryptocurrencies, supporting symbols like EURUSD, GBPUSD, XAUUSD, BTCUSD, NAS100, and others. This tool aids traders in making data-driven decisions based on volume profile analysis.
Customer reviews
5 | 0 % | |
4 | 100 % | |
3 | 0 % | |
2 | 0 % | |
1 | 0 % |


!["[Hamster-Coder] Bollinger Bands" logo](https://cdn.ctrader.com/image/webp/21d8e5d6-fb11-4bac-b9ee-cd05c2b76804_30327)


