Indicator
NAS100
NZDUSD
Breakout
XAUUSD
Commodities
Forex
Fibonacci
Signal
EURUSD
GBPUSD
BTCUSD
SMC
Indices
Prop
Stocks
Supertrend
Crypto
USDJPY
Scalping
Market Structure Pro
"Market Structure Pro" logo
09/10/2025
Desktop
SinceĀ 31/10/2024
Sales
4
Free installs
1366
"Market Structure Pro" uploaded image"Market Structure Pro" uploaded image"Market Structure Pro" uploaded image"Market Structure Pro" uploaded image"Market Structure Pro" uploaded image

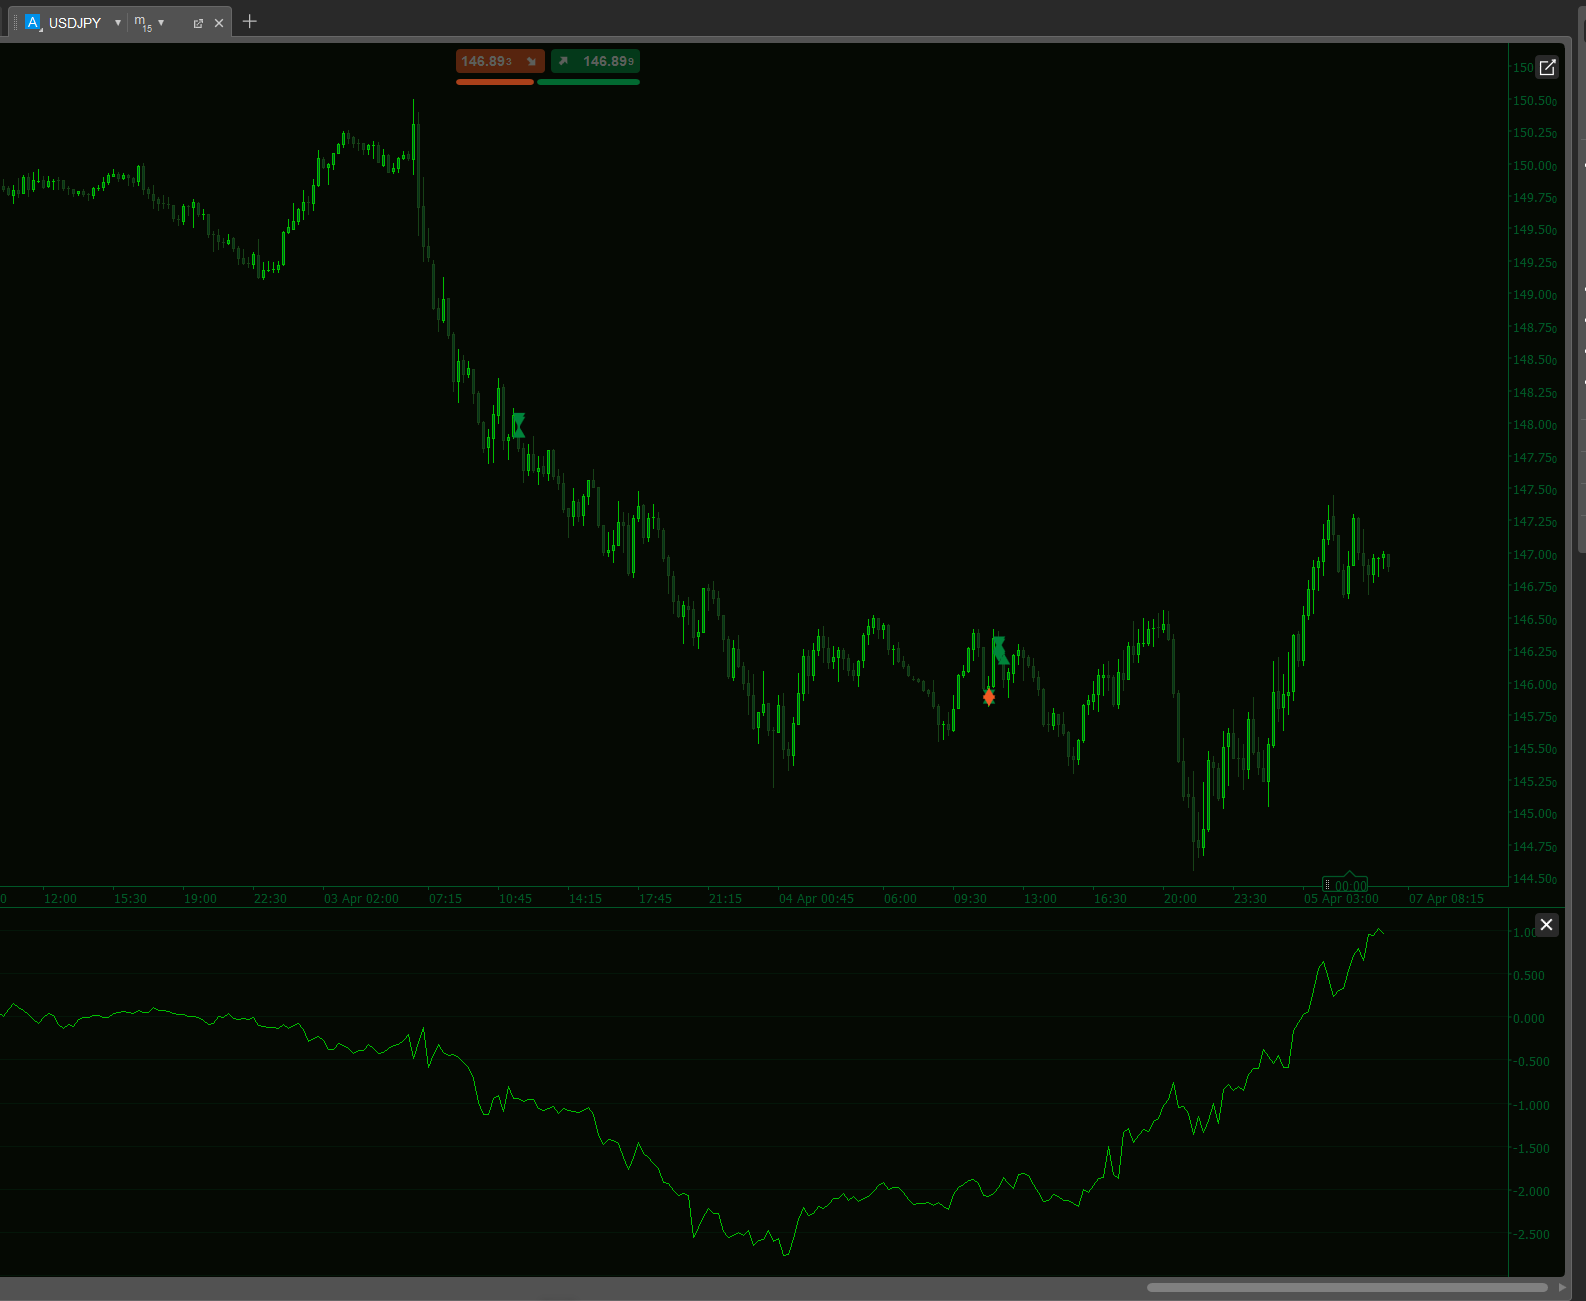
Market Structure Pro automatically maps price structure (HH/HL/LH/LL), builds clean higher-timeframe Support and Resistance levels, and highlights potential pullback or breakout-retest opportunities. A configurable Fibonacci retracement zone keeps focus inside the discount/premium area, with optional candle-based confirmation filters.
Compatible with all symbols and timeframes supported by cTrader.


šŸ”¹ What It Does

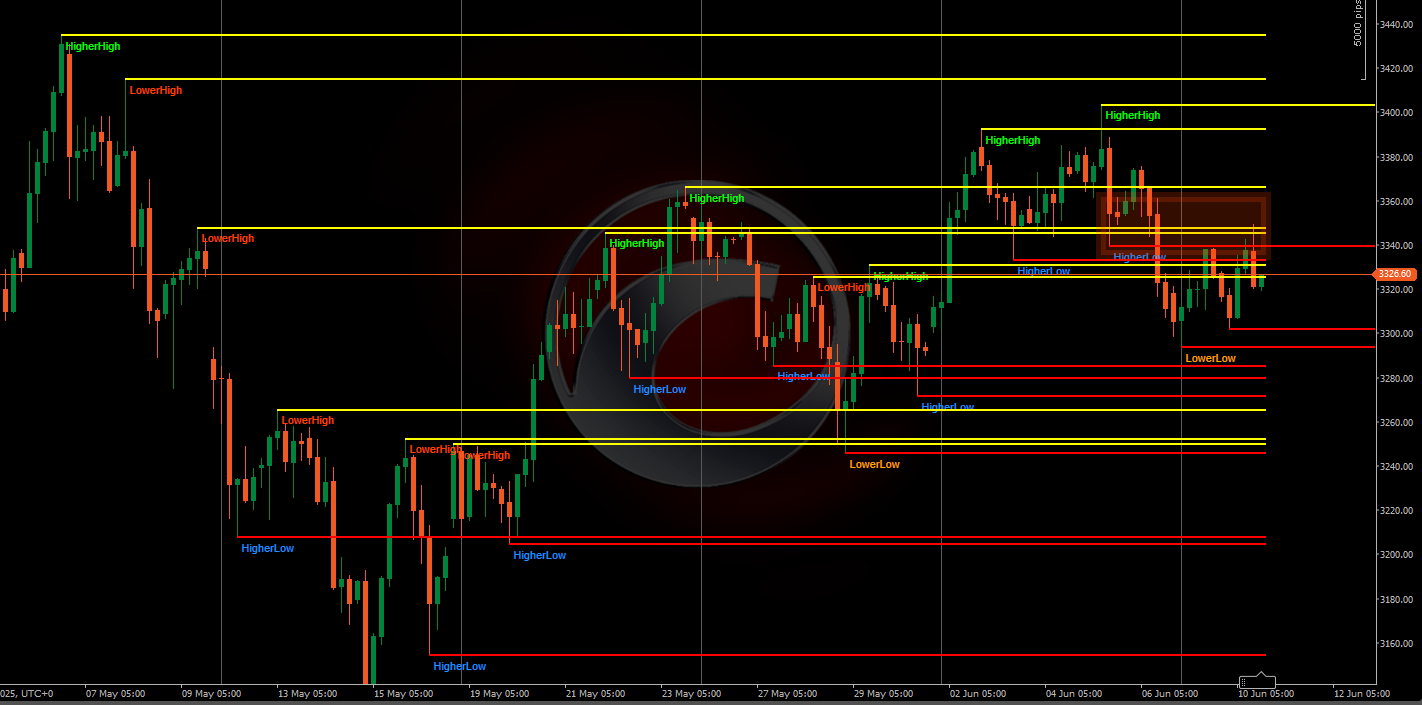
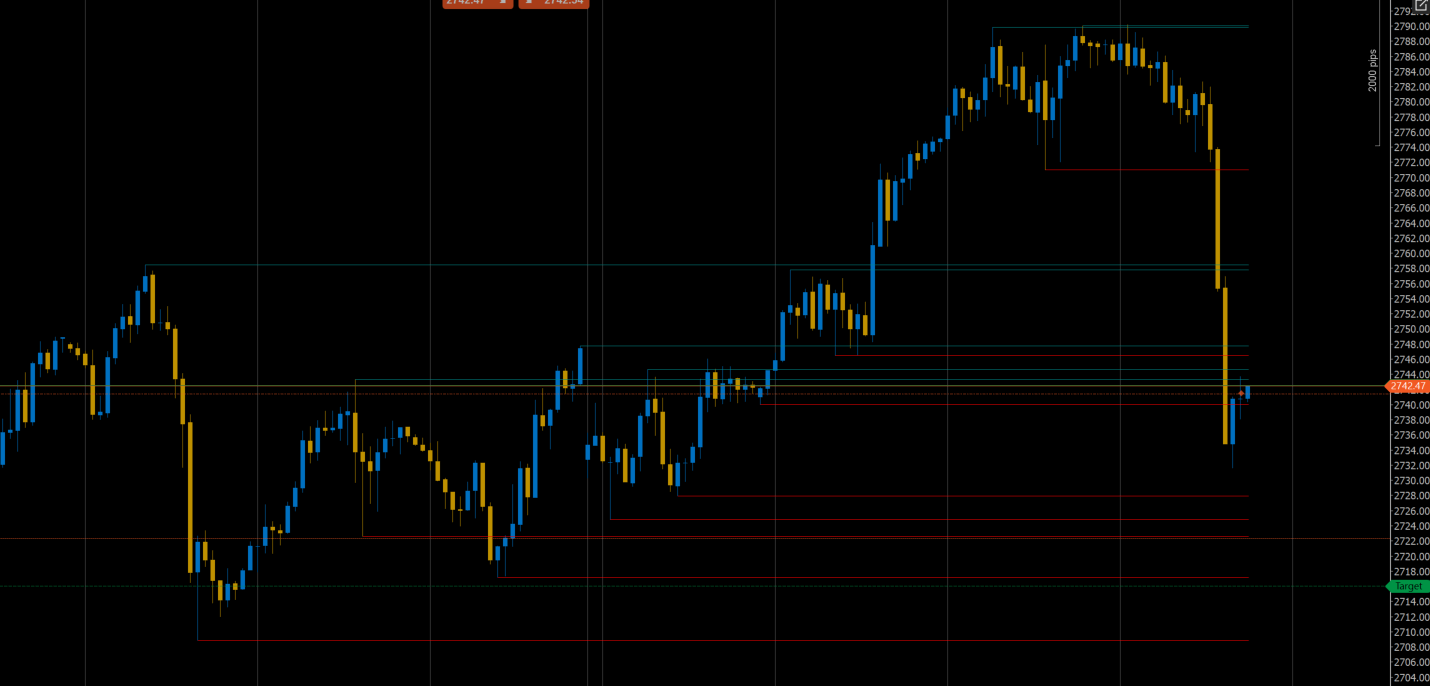
Support / Resistance (MTF)
• Detects swing highs and lows on your selected SR timeframe and merges nearby levels.
• Draws simplified horizontal levels for clear visual zones.
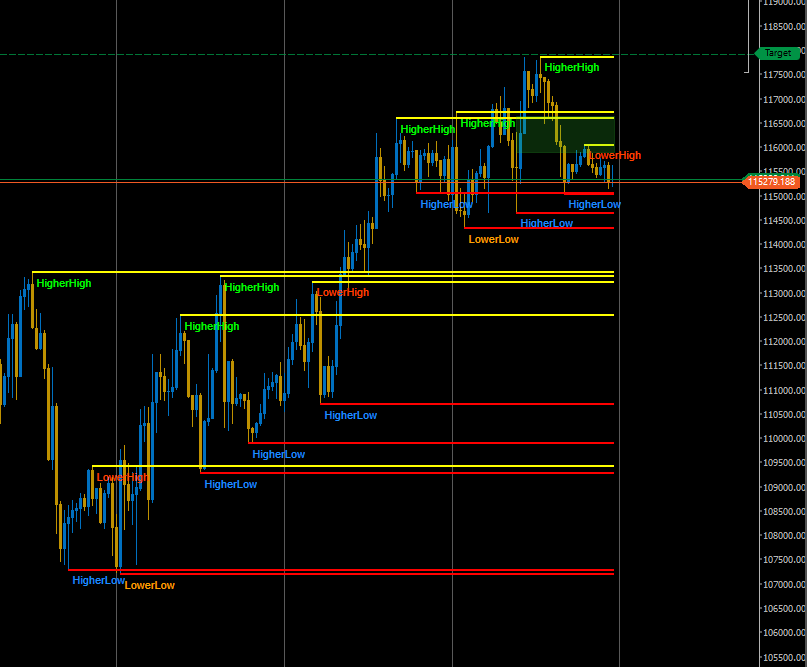
Market Structure
• Displays HH, HL, LH, LL swing labels with distance filtering to reduce chart noise.

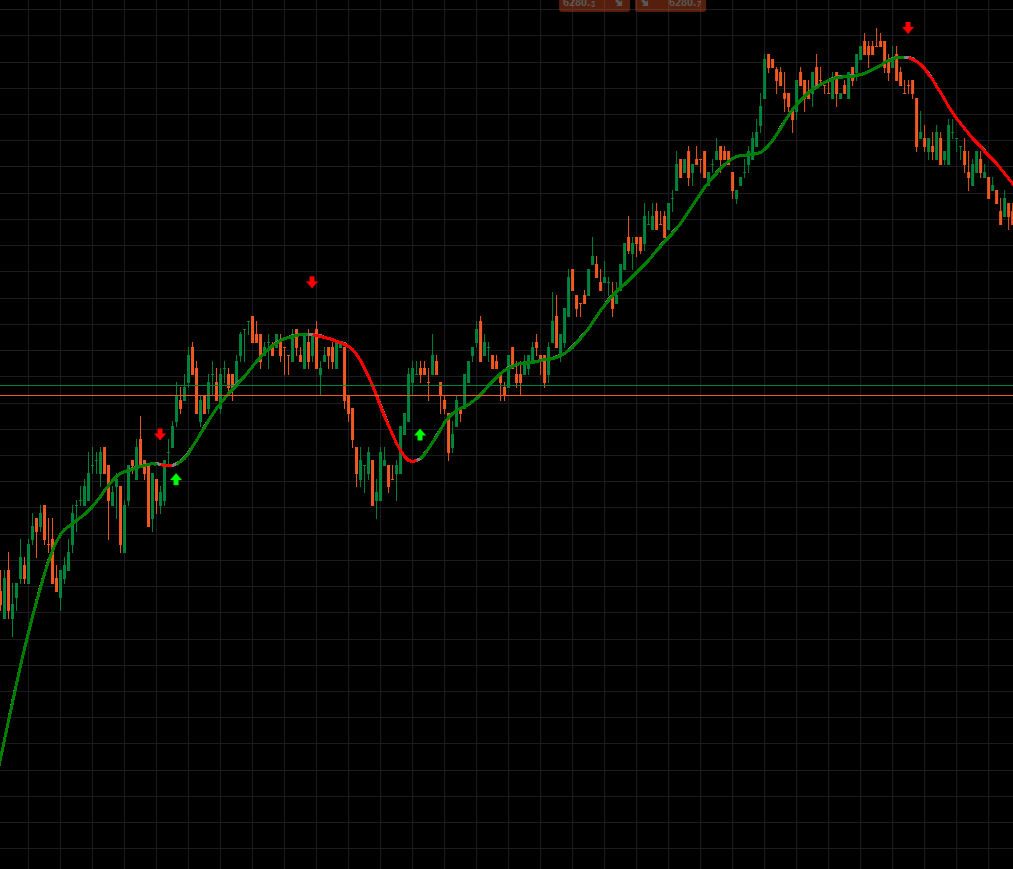
Swing Pullback Logic
• Long: after HL → HH impulse, watches for pullback to HL or support (optionally inside Fib zone).
• Short: mirror logic for LH → LL impulse and resistance.
• Optional confirmation candle (Close-In-Favor / Engulfing / Both) on a separate timeframe.

BOS Pullback Logic
• Long: after breaking the last Lower High, checks pullback near BOS or support.
• Short: after breaking below Higher Low, checks pullback near BOS or resistance.

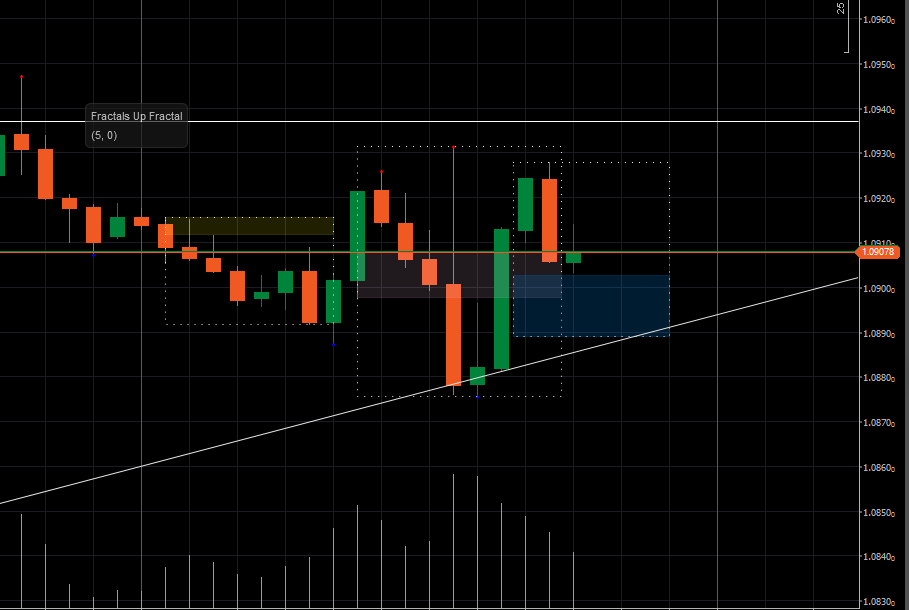
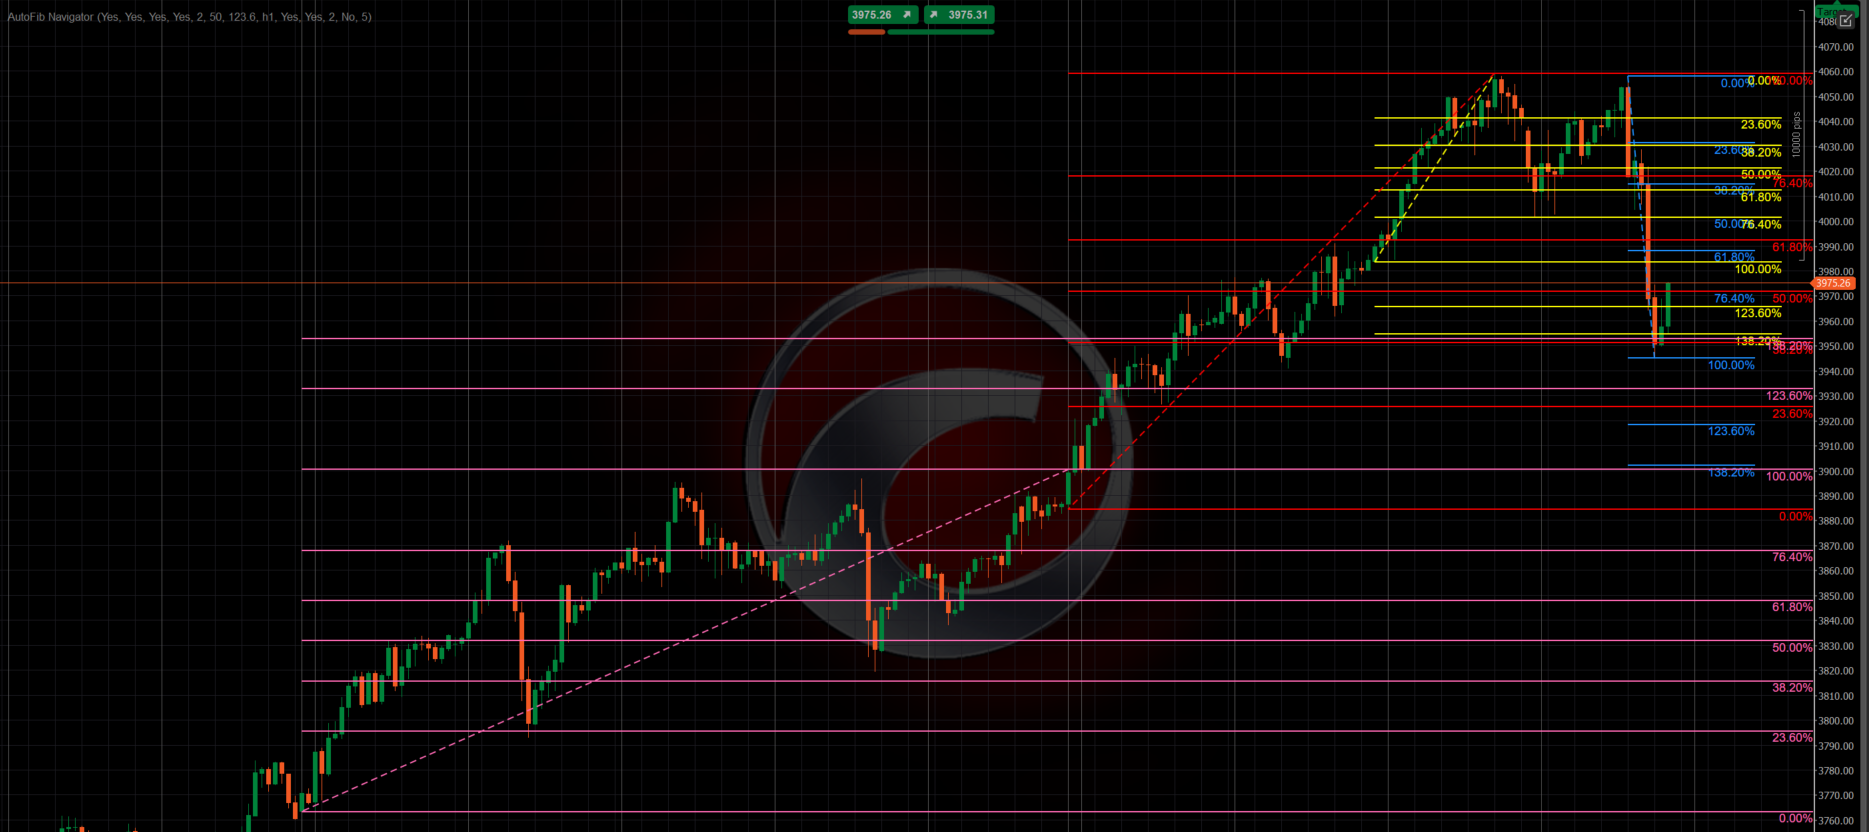
Retracement Band (Fib)
• Draws a live rectangle for the active impulse leg only.
• Custom colors, opacity, and border settings for clear visualization.
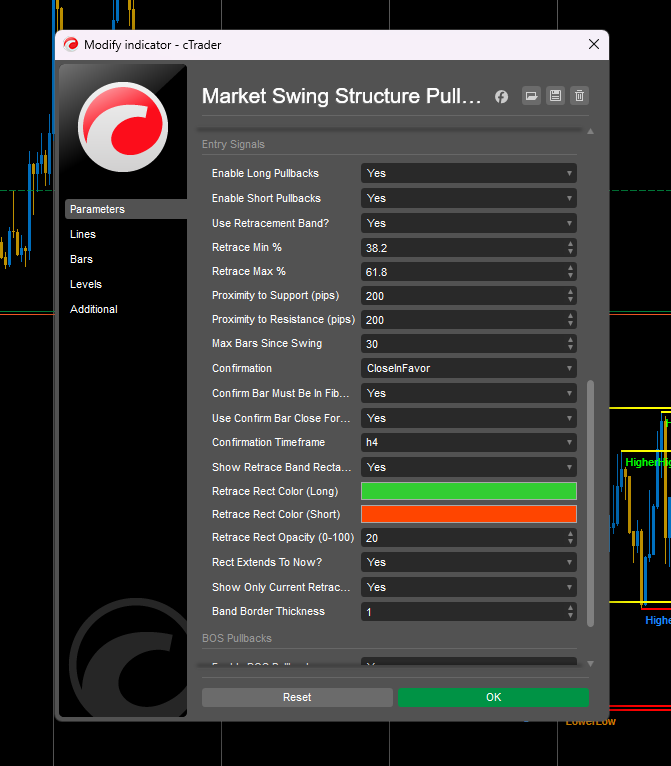
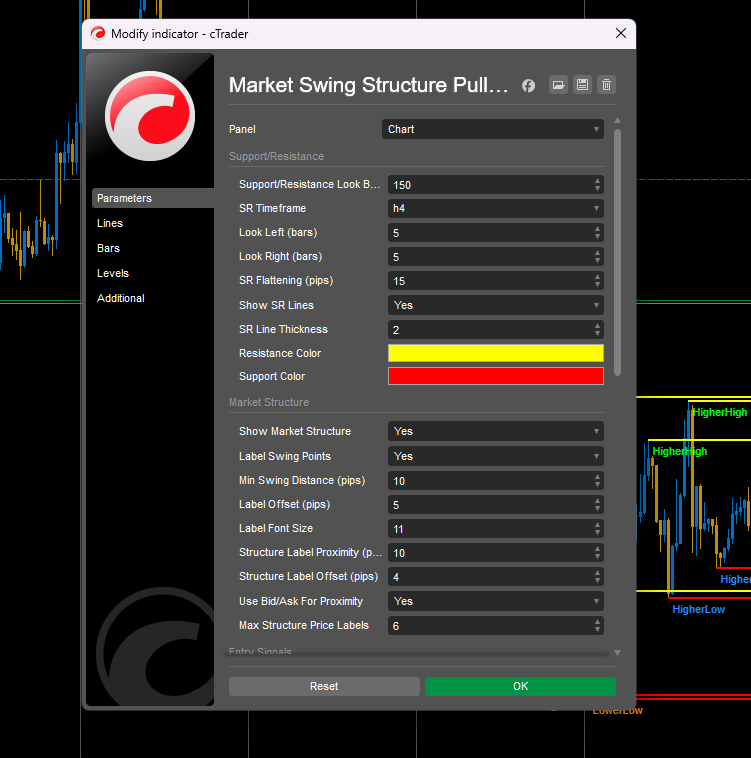

āš™ļø Key Parameters

Support/Resistance
• Look Back, SR Timeframe, Look Left/Right, Flattening (pips)
• Show / Hide SR lines and style settings
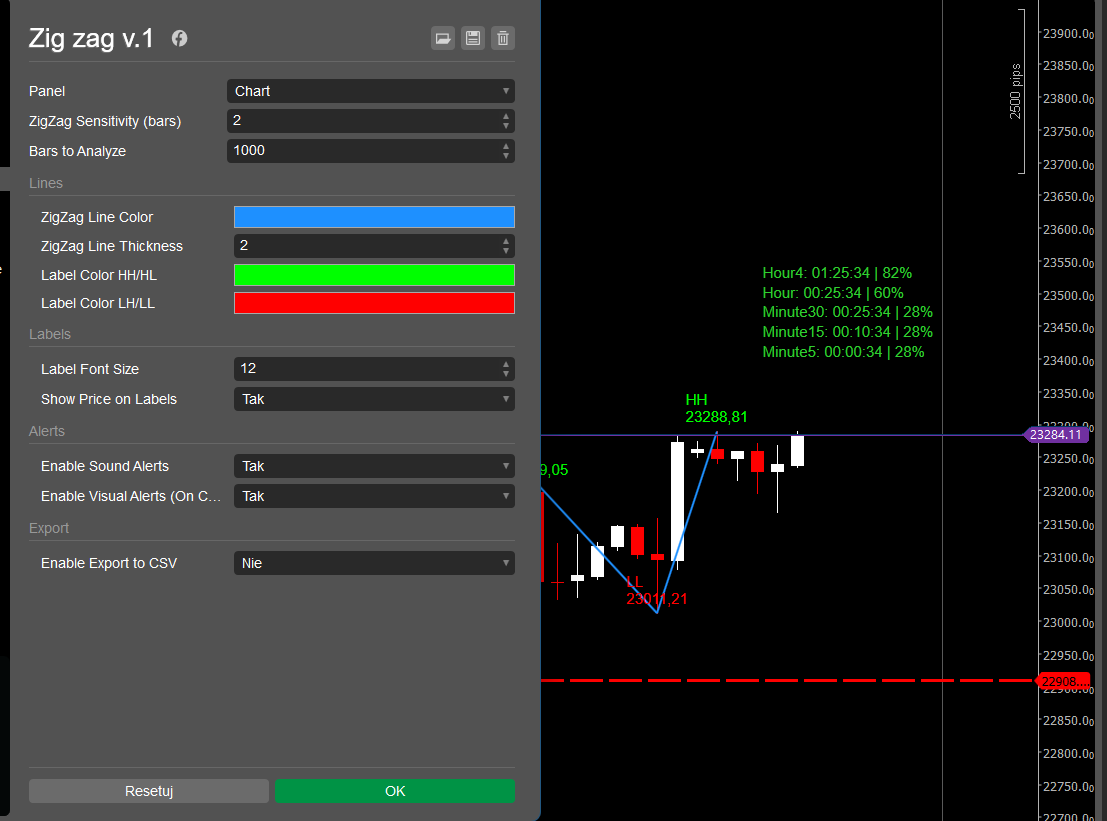
Market Structure
• Label options, minimum swing distance (pips), label offset, and font size
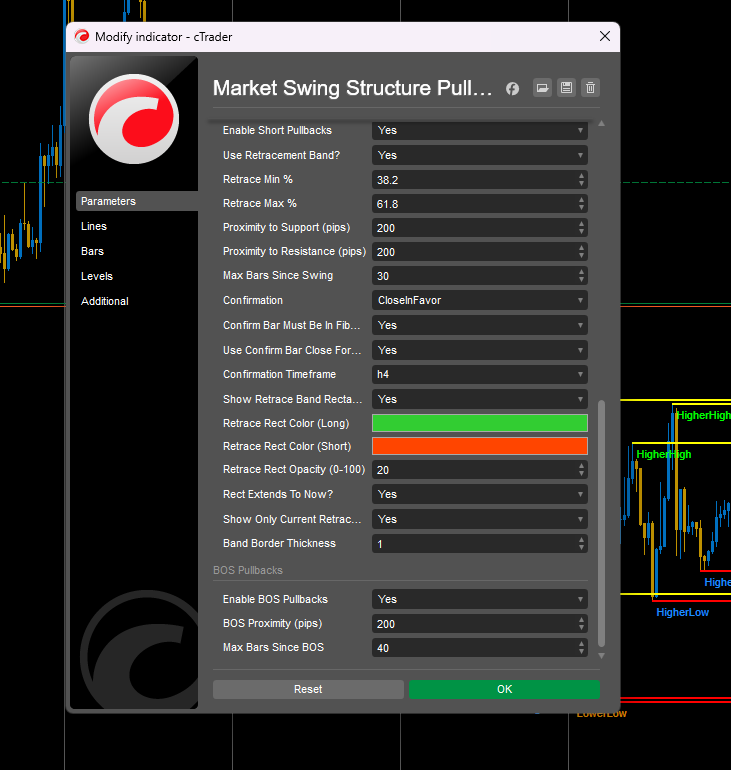
Swing Pullbacks
• Enable Long / Short modes
• Fib Band range (%), SR proximity (pips), bar-age limit
• Confirmation type and timeframe

Retracement Band
• Show/hide controls, color & opacity, extend-to-now option

BOS Pullbacks
• Enable/disable, proximity (pips), recency limit, debug helpers


šŸ’” Usage Tips

• Use higher SR timeframes (e.g., H4 or D1) and trade on lower ones.
• Start with 38.2–61.8% Fib range, adjust for volatility.
• For stronger filters, use Close + Engulfing confirmation on a higher TF.
• Entry markers use Bid for long and Ask for short to reflect actual price feeds.
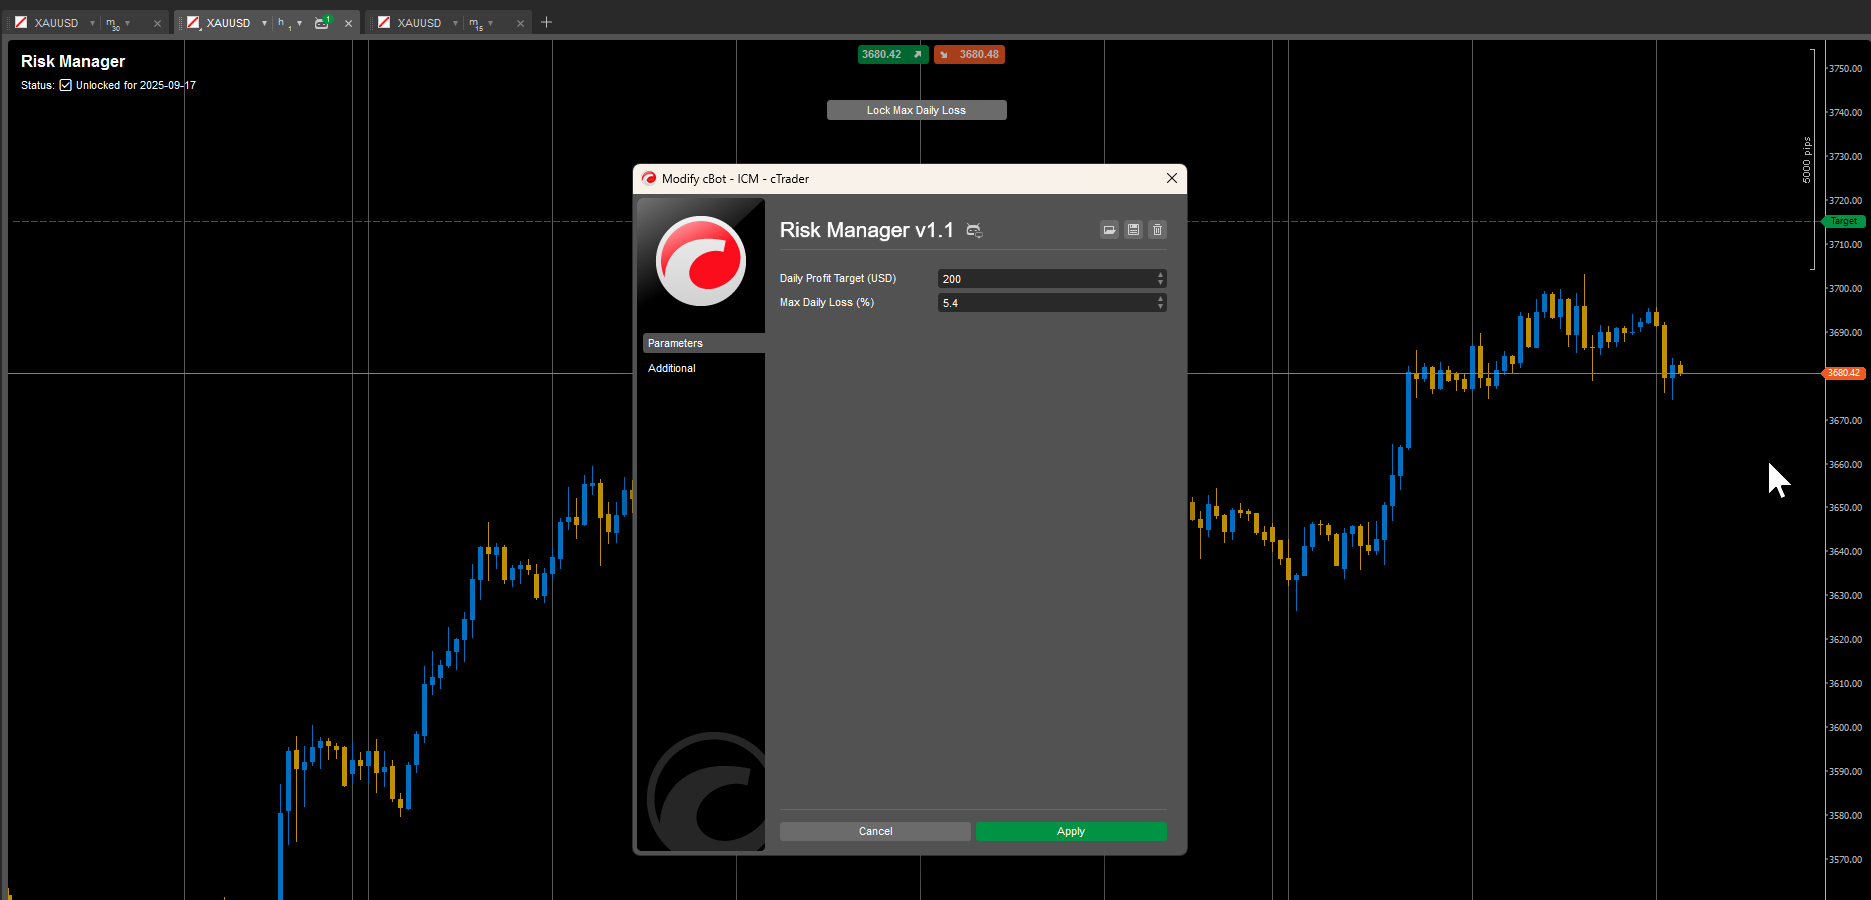

šŸ“¦ Includes

• Indicator only (no automation)
• Works on all instruments and timeframes


āš ļø Notice

Trading in financial markets carries inherent uncertainty. Use this tool for analytical purposes only.


"Trading involves risk. Past performance does not guarantee future results."

More from this author
Indicator
XAUUSD
Breakout
Commodities
CursorByte.SupportResistance v3
Draws support and resistance on all pairs. Multi-timeframe support.
cBot
Prop
Commodities
Forex
+1
Risk Manager v1_1
Daily profit/loss risk manager with lock feature—auto-stops trading once limits are hit.
Indicator
NAS100
NZDUSD
XAUUSD
+10
AutoFib Navigator
Automatically plots Daily and Weekly Fibonacci retracements with smart redraw and session control.
You may also like
calculateSpreads_withSourceCode
Indicator calculates spread in pips
FlexVWAPBand
Ultra-Flexible VWAP Indicator with Advanced Customization
Indicator
Indices
XAUUSD
Breakout
+3
AnchoredVWAP
A precision overlay tool that combines session-aware VWAP logic and standard deviations.
Coloring Trendline with arrows
Coloring trendline/ Colored Trendline / Color Trendline
Indicator
Bollinger
Repiptor BB Colored Width
Colored Bollinger Bands Width
Break of Structure
The Break of Structure (BoSCHoCh) Indicator is a smart market structure tool designed to help traders easily spot trend.
FREEE Tradingview Economic Calendar on Chart
Customizable window inside your platform, access to any website Calendar Was Free for early users now -50%
Daily Sessions HighLow Helper
Shows daily and sessions highs / lows and session boxes, everything configurable
Indicator
Indices
ATR
Stocks
+5
UT Bot Alerts Nova
UT Bot Alerts Nova: Advanced trend-following indicator using ATR for signals. Precise entries/exits.
Indicator
Indices
Prop
Stocks
+5
New Way Sar - Free
The Parabolic SAR, or "Stop and Reverse," is a dynamic technical analysis tool
Fisher_m11
Fisher Transform with smoothing. Spot reversals and cycles with precision. Great for any market, any timeframe.
Vishal Volume Profile v2.0
Volume Profile plots traded volume at each price level, highlighting high activity zones of precise support & resistance
Indicator
Grid
NAS100
NZDUSD
+16
3D HeikenAshi bY Mohammad KHR
Clean 3D, Sleek Candles for Trend Patterns.
Indicator
Indices
Forex
Signal
+2
US Dollar Index
US Dollar Index
Zig zag v.1 Demo
ZigZag Pro DEMO – Multi-Swing Indicator for cTrader DEMO VERSION – 24 hours free trial! This is a DEMO version of the Z
Weekly Daily Levels
The Weekly Daily Levels indicator shows the OHLC, and mid-point prices for the previous day and week.
AlphaTrend Pro by LudwigICT
LDE - Market Sessions
šŸ‡«šŸ‡· Visualisez vos sessions de marchĆ© et OPR d'un coup d’œil šŸ‡¬šŸ‡§ Visualize your market sessions & OPR at a glance !