
BWMFI_Visual
Gösterge
79 i̇ndirmeler
Sürüm 1.0, May 2025
Windows, Mac
Açıklama
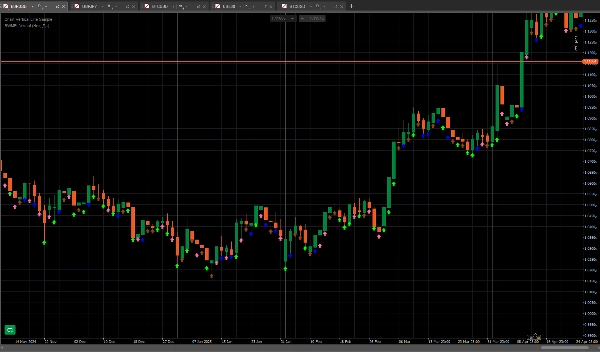
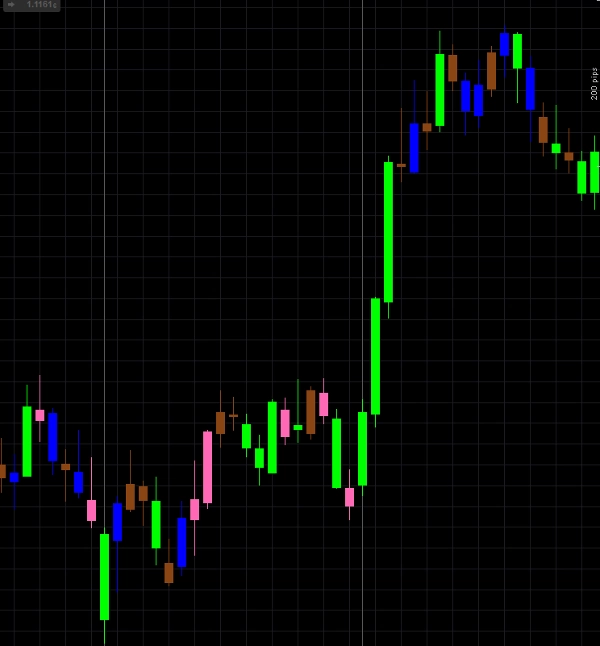
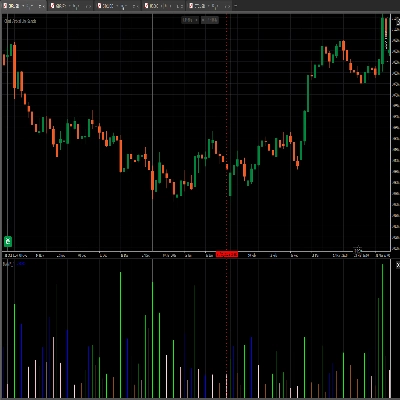
BW_MFI Görsel renk çubukları
Özet
YZ özeti
BWMFI_Visual is a trading indicator that visually represents the Money Flow Index (MFI) using color-coded bars. It provides a graphical display of the MFI values to assist traders in analyzing market momentum and potential price reversals. The indicator focuses on enhancing the visual interpretation of the MFI by applying distinct colors to the bars, facilitating quicker and clearer decision-making. This tool is designed for integration within trading platforms that support custom indicators.
Gösterge profili
Müşteri değerlendirmeleri
0.0
Değerlendirmeler: 0
Müşteri değerlendirmeleri
Bu ürün için henüz bir değerlendirme yok. Ürünü denediniz mi? O zaman ona dair görüşlerini paylaşan ilk kişi olun!
Tartışma
SSS
cTrader Store üzerinden erişilebilen işlem botları, göstergeler ve eklentiler gibi ürünler, üçüncü taraf sağlayıcılar tarafından sağlanır ve yalnızca bilgilendirme ve teknik erişim amaçlarıyla sunulur. cTrader Store bir broker değildir ve yatırım tavsiyesi, kişisel öneriler vermez veya gelecekteki performansı garanti etmez.
Bu oluşturanın diğer ürünleri


!["High-Low Divergence [Iridio Capital]" logosu](https://cdn.ctrader.com/image/webp/443c4661-7abb-40f1-842f-4b6ec560649b_40914)
Fiyat
Başlangıç 10/03/2025
139
Ücretsiz yüklemeler