
50 percent
Indicador
Versión 1.0, Aug 2025
Windows, Mac
5.0
Valoraciones: 2

Descripción
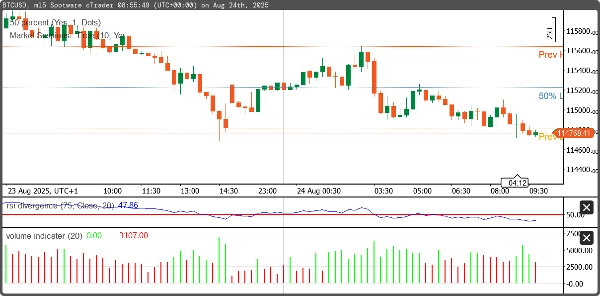
Este cBot detecta automáticamente los precios máximos y mínimos de la sesión anterior y calcula el punto medio entre ellos. Está diseñado para ayudar a los traders identificando zonas clave de soporte/resistencia y niveles de equilibrio del mercado, que a menudo se utilizan para estrategias de reversión o ruptura.
- Detecta el máximo y mínimo del día (o sesión) anterior.
- Calcula el punto medio entre el máximo y el mínimo.
- Traza los niveles de máximo, mínimo y punto medio en el gráfico.
Resumen
Perfil del indicador
Valoraciones de clientes
5.0
Valoraciones: 2
5 | 100 % | |
4 | 0 % | |
3 | 0 % | |
2 | 0 % | |
1 | 0 % |
Valoraciones de clientes
August 29, 2025
The screen feels less crowded, but the final call still needs say no.
August 20, 2025
Conversación
Preguntas frecuentes
Los productos disponibles a través de cTrader Store, incluidos bots, indicadores y plugins para operar, son proporcionados por desarrolladores de terceros y están disponibles únicamente con fines informativos y de acceso técnico. cTrader Store no es un bróker, por lo que no proporciona asesoramiento de inversión, recomendaciones personales ni ninguna garantía de rentabilidad futura.
Más de este autor


![Logotipo de "[Stellar Strategies] Inside Bar with Signals"](https://cdn.ctrader.com/image/webp/1d9e8bfa-3b2c-4440-bb37-5856902008a7_30683)


Precio
Desde 14/05/2025
10.1M
Volumen operado
81.44K
Pips ganados
201
Instalaciones gratis