
ADX and ADI
Indicador
258 descargas
Versión 1.0, Aug 2025
Windows, Mac
5.0
Valoraciones: 2
Descripción
Características clave:
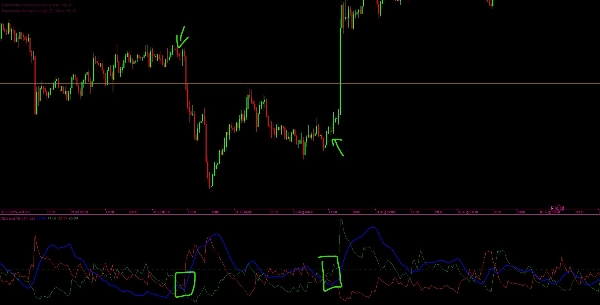
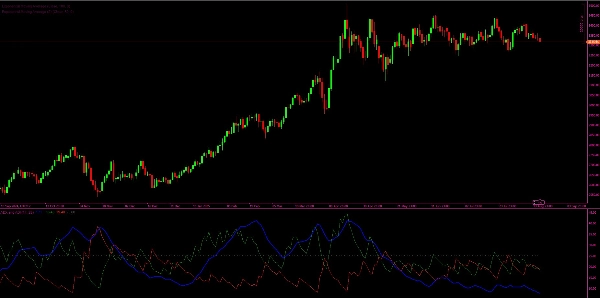
- Línea ADX y ADI (Azul): Muestra la fuerza suavizada de la tendencia actual, independientemente de la dirección.
- Línea +DI (Verde): Indica la fuerza de los movimientos ascendentes.
- Línea -DI (Rojo): Indica la fuerza de los movimientos descendentes.
- Línea de umbral (Gris): Un nivel de referencia horizontal (por defecto 25) para ayudar a identificar si la fuerza de la tendencia es significativa.
Cómo funciona:
- El indicador calcula Rango Verdadero (TR), Movimiento Direccional Positivo (+DM), y Movimiento Direccional Negativo (-DM).
- Aplica la técnica de suavizado de Wilder para calcular los valores suavizados de TR, +DM y -DM.
- A partir de estos, se derivan los Indicadores Direccionales (+DI y -DI), mostrando qué lado (alcista o bajista) tiene un impulso más fuerte.
- Se calcula el DX (Índice Direccional) a partir de la diferencia relativa entre +DI y -DI.
- Finalmente, se calcula el ADX (Índice Direccional Promedio) como una versión suavizada del DX, proporcionando una medida de la fuerza general de la tendencia.
Interpretación:
- Cuando el ADX está por encima del umbral (por ejemplo, 25), se considera que el mercado está en una tendencia fuerte.
- Cuando +DI > -DI, los toros tienen el control (tendencia alcista).
- Cuando -DI > +DI, los osos tienen el control (tendencia bajista).
- Cuando el ADX está por debajo del umbral, se considera que el mercado está en rango (tendencia débil o inexistente).
Resumen
Perfil del indicador
Valoraciones de clientes
5.0
Valoraciones: 2
5 | 100 % | |
4 | 0 % | |
3 | 0 % | |
2 | 0 % | |
1 | 0 % |
Valoraciones de clientes
December 1, 2025
ADX and ADI delivers clean trend strength and direction signals. ADX shows when the market is actually trending, while +DI and -DI reveal who’s in control. Stable, lightweight and reliable across all timeframes. Best on H1+ for smoother signals. Alerts and zone-highlighting would be great additions.
September 12, 2025
Conversación
Preguntas frecuentes
Los productos disponibles a través de cTrader Store, incluidos bots, indicadores y plugins para operar, son proporcionados por desarrolladores de terceros y están disponibles únicamente con fines informativos y de acceso técnico. cTrader Store no es un bróker, por lo que no proporciona asesoramiento de inversión, recomendaciones personales ni ninguna garantía de rentabilidad futura.


![Logotipo de "[CB] Pivot Points Pro"](https://cdn.ctrader.com/image/webp/43463c82-67b0-4f10-a4ba-901bba091d81_32594)


Precio
Desde 21/02/2025
466.3M
Volumen operado
180.83K
Pips ganados
22
Ventas
6.79K
Instalaciones gratis