Descripción
RESUMEN
Este indicador implementa la metodología "Identificación de Tendencias mediante Filtrado de Precio y Tiempo" de Alfred François Tagher, publicada en la edición de febrero de 2024 de la revista Technical Analysis of Stocks & Commodities.
El concepto combina la acción del precio con un filtrado basado en el tiempo para reducir el ruido del mercado e identificar tendencias sostenidas. En lugar de reaccionar a cada movimiento de precio, el indicador solo cambia la dirección de la tendencia cuando el precio cierra fuera del rango del período anterior, una condición que señala un impulso genuino en lugar de una fluctuación aleatoria.
REGLAS PRINCIPALES
Las reglas originales son simples:
- Si el cierre del período supera el máximo del período anterior → la tendencia es AL ALZA
- Si el cierre del período está por debajo del mínimo del período anterior → la tendencia es A LA BAJA
- La tendencia permanece sin cambios hasta que ocurre una condición de reversión
Este enfoque filtra los movimientos menores de precio que permanecen dentro del rango del período anterior, enfocándose solo en rupturas que demuestran compromiso.
CÓMO FUNCIONA
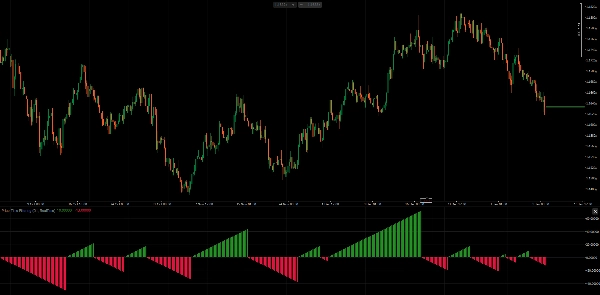
El indicador compara el cierre del marco temporal actual con el máximo y mínimo del período anterior del marco temporal superior seleccionado:
- Tendencia al alza: Cierre actual > máximo del período anterior
- Tendencia a la baja: Cierre actual < mínimo del período anterior
- Sin cambio: El cierre permanece dentro del rango del período anterior
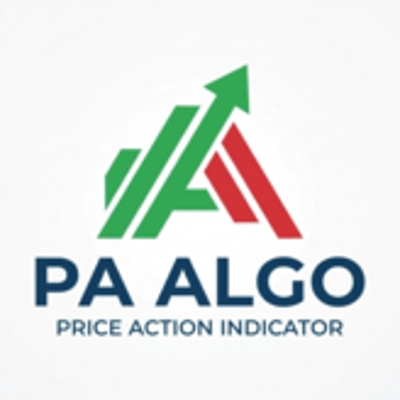
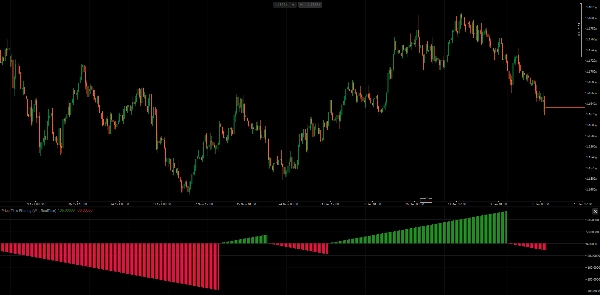
El histograma muestra un conteo acumulativo de barras en la dirección de la tendencia actual—valores positivos para tendencias alcistas, valores negativos para tendencias bajistas. Esto visualiza tanto la dirección como la duración de la tendencia.
MODOS DE FILTRADO
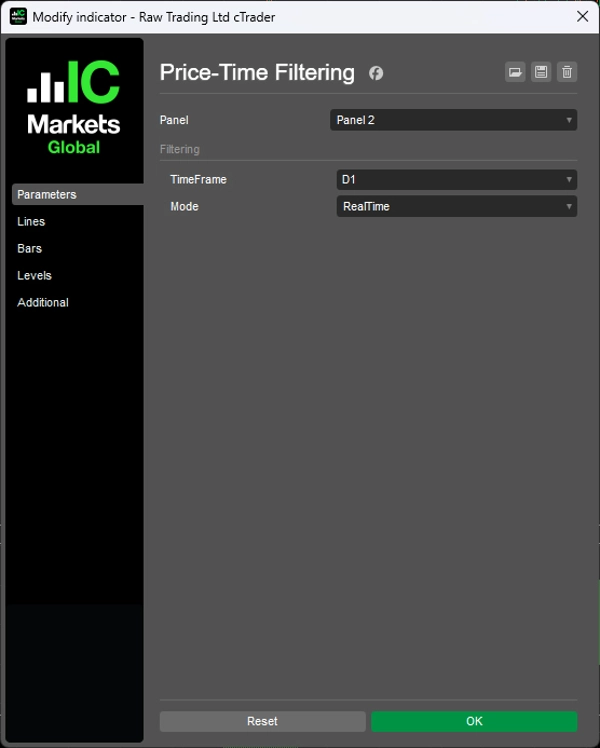
1. Modo PeriodEnd Evalúa la tendencia solo cuando se completa un período del marco temporal superior. Esto coincide con la metodología original donde la tendencia semanal se determina por el cierre del viernes (o cierre de fin de mes para mensual). Más estable, menos señales.
2. Modo RealTime Evalúa la tendencia en cada barra usando el cierre actual contra el rango del período anterior. Proporciona señales más tempranas pero puede generar más ruido durante el período.
PARÁMETROS
- TimeFrame: Marco temporal superior para la evaluación de la tendencia (por ejemplo, Semanal, Mensual)
- Modo: PeriodEnd (metodología original) o RealTime (variante reactiva)
INTERPRETACIÓN
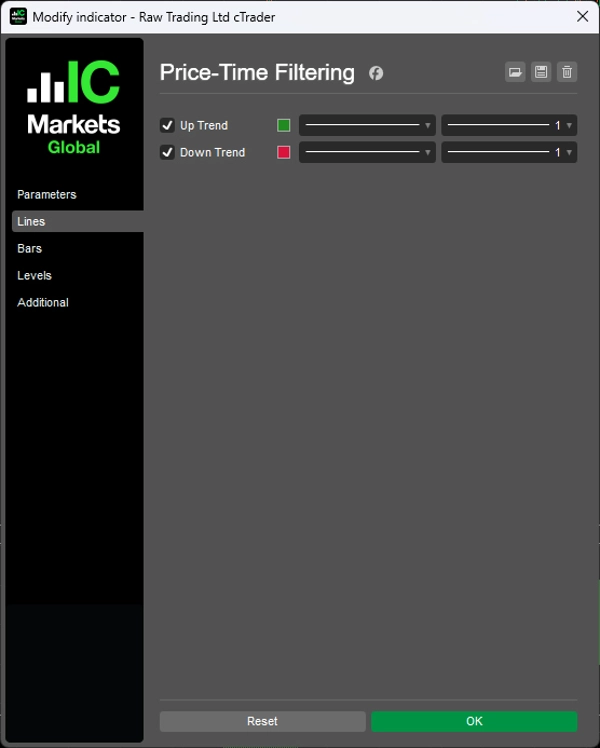
- Histograma verde: Tendencia alcista en progreso, el conteo de barras muestra la duración
- Histograma rojo: Tendencia bajista en progreso, el conteo de barras muestra la duración
- Reinicio del histograma: Ocurrió una reversión de tendencia
El indicador funciona mejor en gráficos diarios con selección de marco temporal Semanal o Mensual, como se describe en el artículo original. Sin embargo, la implementación soporta cualquier combinación de marcos temporales.
NOTAS
- Diseñado originalmente para gráficos diarios con evaluación semanal/mensual
- Funciona en cualquier combinación de marcos temporales donde el marco temporal seleccionado sea superior al del gráfico
- El conteo de barras proporciona una medida de madurez de la tendencia—conteos más largos sugieren tendencias establecidas
- Considere combinar con análisis de estructura de precios para el momento de entrada
REFERENCIA
Tagher, Alfred François. "Trend Identification By Price And Time Filtering." Technical Analysis of Stocks & Commodities, febrero de 2024.
__________________________________________________________________________________________
MÁS INDICADORES GRATUITOS
Explora una amplia gama de herramientas de análisis de mercado—desde estructura y volumen hasta regresión, volatilidad y marcos temporales personalizados.
El código fuente está disponible en el repositorio de GitHub repository.
Todos son gratuitos para usar. Pero si deseas apoyar con un café, puedes hacerlo aquí.
Soporte/Resistencia
Volumen
- Perfilador de Actividad de Volumen
- Analizador de Eficiencia de Volumen
- Análisis de Perfil de Volumen
- Perfil de Volumen - Actualizado
- Análisis de Spread de Volumen
- VWAP (Precio Promedio Ponderado por Volumen)
Medias Móviles
- Canal SSL
- Media Móvil Anclada
- Media Móvil Escalada por Desviación
- Activador Gann High Low
- Línea de Tendencia Instantánea
- Media Móvil Adaptativa Kaufman con Visión de Tendencia
- Canal de Media Móvil
- Suite de Medias Móviles
- Media Móvil de Canal de Tendencia
Utilidades/Personalizados
Basado en Regresión
Volatilidad
Osciladores
__________________________________________________________________________________________
AVISO LEGAL
El trading implica riesgos. Este indicador está destinado solo para análisis técnico — siempre aplique una gestión adecuada del riesgo y opere con responsabilidad.
COMENTARIOS Y MEJORAS
Si tienes sugerencias, solicitudes de funciones o ideas para mejoras, por favor deja un comentario en la pestaña de Discusión. Tus comentarios ayudan a mejorar el indicador para todos.
Resumen
The indicator supports two filtering modes: PeriodEnd mode, which evaluates trends only at the close of a higher timeframe period (e.g., weekly or monthly), providing more stable signals; and RealTime mode, which updates trend status on every bar for more responsive but potentially noisier signals. Users can select the higher timeframe for trend evaluation, typically weekly or monthly, while applying the indicator on lower timeframe charts.
A histogram visually represents trend direction and duration, with positive values and green bars indicating uptrends, negative values and red bars indicating downtrends, and resets marking trend reversals. The indicator is applicable across various markets including Forex, indices, commodities, crypto, and stocks, and supports any timeframe combination where the selected higher timeframe exceeds the chart timeframe.