
Descripción
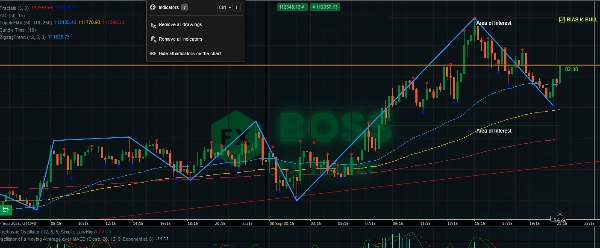
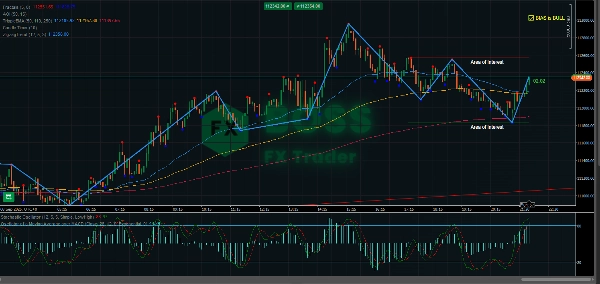
El Indicador ZigZag es una herramienta de estructura de mercado que filtra las pequeñas fluctuaciones de precio y resalta los principales máximos y mínimos. Al conectar estos puntos con líneas, los traders pueden identificar fácilmente tendencias, reversiones y patrones de gráfico.
No genera señales de compra/venta por sí mismo, pero cuando se combina con la acción del precio, soporte/resistencia u otros indicadores, se vuelve poderoso para estrategias de scalping, intradía y swing.
🔎 Características Clave
- Simplifica el ruido del mercado mostrando oscilaciones claras de precio.
- Ayuda a identificar niveles de soporte y resistencia.
- Útil para detectar patrones de gráfico (hombro cabeza hombro, dobles techos/suelos, triángulos).
- Ayuda en la confirmación de tendencias y entradas en retrocesos.
- Flechas de señal VENDER y COMPRAR en cada oscilación.
⚡ Scalping con ZigZag
- Marcos de tiempo: 1m – 5m
- Objetivo: Capturar movimientos pequeños pero frecuentes.
- Cómo usar:
-
- Espera a que se forme un nuevo máximo/mínimo.
- Marca estos como micro-soporte o resistencia.
- Entra en operaciones en rupturas o retrocesos hacia estos niveles ZigZag.
- Mantén el stop-loss justo más allá de la última oscilación (riesgo ajustado).
- Apunta a un TP rápido (5–15 pips dependiendo de la volatilidad).
👉 Funciona mejor en sesiones de alta volatilidad (apertura de Londres / Nueva York).
⏱️ Trading Intradía con ZigZag
- Marcos de tiempo: 15m – 1H
- Objetivo: Operar tendencias diarias y reversiones clave intradía.
- Cómo usar:
-
- Identifica la tendencia intradía principal usando oscilaciones ZigZag más altas.
- Usa los puntos ZigZag como zonas pivote para la entrada (compra en caídas en tendencia alcista, vende en repuntes en tendencia bajista).
- Combina con osciladores (RSI/Estocástico) para confirmar sobrecompra/sobreventa cerca de los extremos ZigZag.
- Usa el máximo/mínimo de oscilación previo como niveles lógicos de SL/TP.
👉 Ideal para traders diarios que buscan movimientos de 20–50 pips.
📆 Swing Trading con ZigZag
- Marcos de tiempo: 4H – Diario
- Objetivo: Capturar grandes movimientos de tendencia y operaciones de posición.
- Cómo usar:
-
- Usa ZigZag para identificar la estructura principal del mercado (máximos más altos y mínimos más altos = tendencia alcista).
- Entra después de retrocesos cuando se forme un nuevo mínimo en una tendencia alcista.
- Coloca SL debajo de un mínimo importante.
- Apunta a 2–3 veces el riesgo, o al siguiente nivel de oscilación ZigZag.
- Usa ZigZag para detectar patrones de reversión (doble techo/suelo, hombro cabeza hombro) para salidas.
👉 Ideal para mantener operaciones por días a semanas.
📌 Consejos Profesionales
- Ajusta la Profundidad: Más pequeña = más sensible (bueno para scalping). Más grande = filtra ruido (mejor para swing).
- Combina con volumen, filtros de tendencia o medias móviles para confirmación.
- Siempre verifica un ZigZag de marco temporal superior antes de entrar — las oscilaciones pequeñas dentro de una tendencia mayor pueden ser trampas.
- Usa ZigZag para validar patrones de gráfico (triángulos, cuñas).
¡Mantente rentable!


![Logotipo de "Gaussian Channel [Iridio Capital]"](https://cdn.ctrader.com/image/webp/7c039209-5573-4a54-a072-f9528b503103_41960)


