
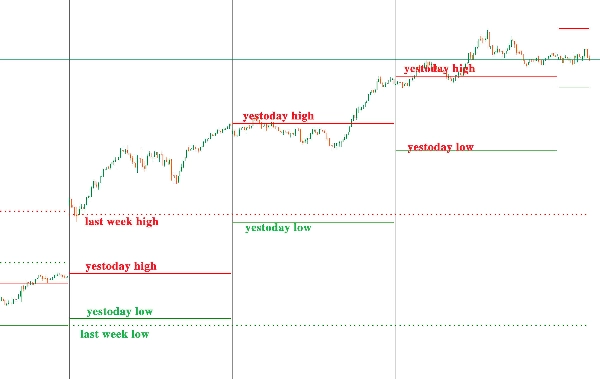
El indicador "Niveles Diarios" se utiliza para mostrar el máximo/mínimo de la semana pasada y el máximo/mínimo de ayer en diferentes marcos temporales.
Máximo/mínimo de la semana pasada: Marcado con líneas discontinuas gruesas;
Máximo/mínimo de ayer: Marcado con líneas sólidas finas.
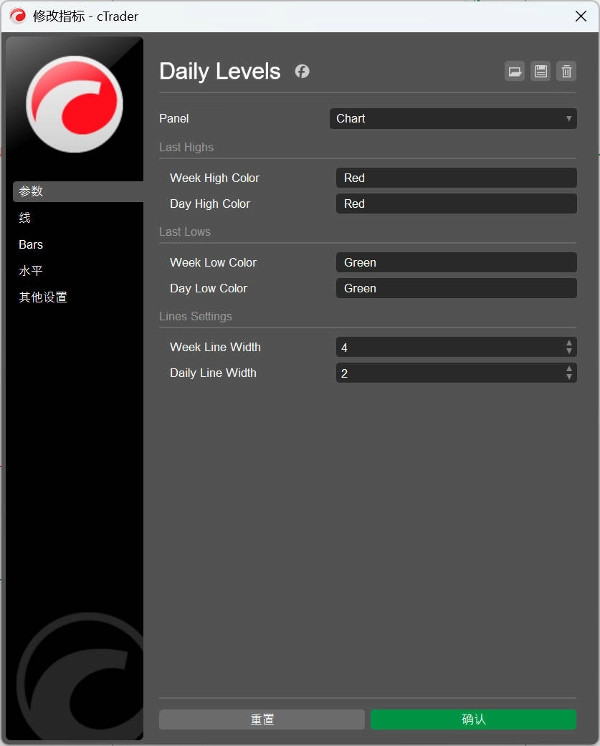
Los usuarios pueden personalizar los colores y el grosor de las líneas.
“Daily Levels”指标用于在不同的时框框架下显示上周最高价/最低价和昨天最高价/最低价。
上周最高/最低价:使用粗虚线标注;
昨天最高/最低价:使用细实线标注。
用户可以自定义颜色和线条粗细。
Perfil del indicador
0.0
Valoraciones: 0
Valoraciones de clientes
Este producto todavía no se ha valorado. ¿Ya lo ha probado? Sea el primero en informar a otros.
Forex
Signal
Breakout
Indices
Commodities
Crypto
Los productos disponibles a través de cTrader Store, incluidos bots, indicadores y plugins para operar, son proporcionados por desarrolladores de terceros y están disponibles únicamente con fines informativos y de acceso técnico. cTrader Store no es un bróker, por lo que no proporciona asesoramiento de inversión, recomendaciones personales ni ninguna garantía de rentabilidad futura.


Desde 30/09/2024
44
Ventas