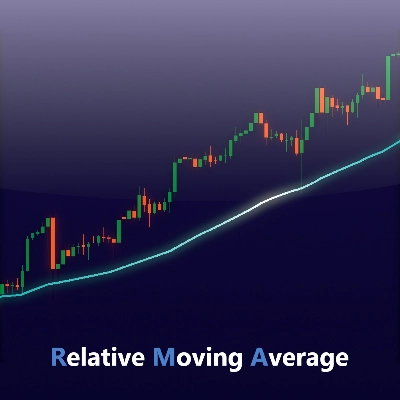
Presentamos el Indicador de Media Móvil Relativa (RMA), ¡ahora disponible para cTrader!
La Media Móvil Relativa (RMA) — también conocida como Media Móvil Suavizada (SMMA) — es un tipo de media móvil que busca reducir el retraso manteniendo la suavidad en la curva. Es la misma fórmula utilizada por la función “RMA” incorporada en TradingView, que se usa ampliamente en indicadores populares como el Índice de Fuerza Relativa (RSI).
La RMA está diseñada para equilibrar la capacidad de respuesta y la estabilidad. Se actualiza de forma más suave que una Media Móvil Exponencial (EMA) pero reacciona más rápido a los cambios de precio que una Media Móvil Simple (SMA).
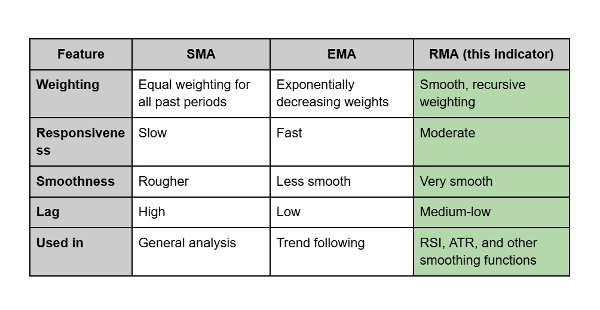
Cómo se diferencia:
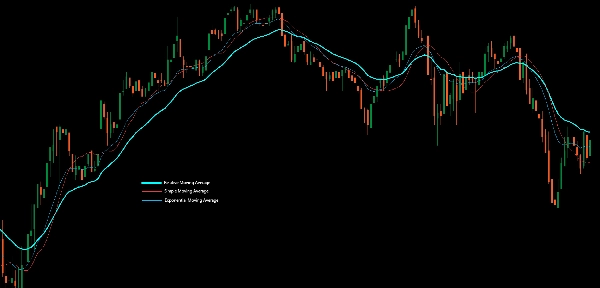
- La SMA promedia todos los precios por igual, causando retraso y oscilaciones.
- La EMA da más peso a los precios recientes, haciéndola muy sensible pero a veces ruidosa.
- La RMA, en contraste, combina los beneficios de ambas: suaviza la volatilidad mientras mantiene reacciones oportunas a los cambios de precio.
Uso práctico:
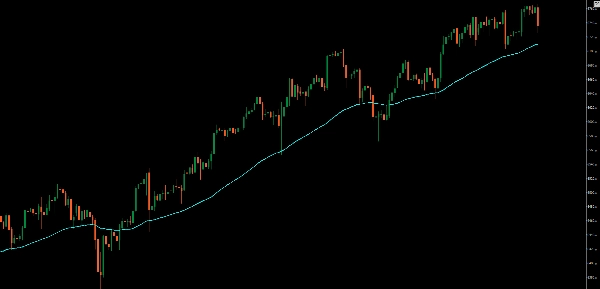
Los traders suelen usar la RMA como una línea de tendencia más suave o como parte de indicadores de momentum. Es particularmente efectiva cuando quieres filtrar el ruido sin introducir un retraso significativo — ideal para confirmar tendencias a largo plazo o apoyar análisis de sobrecompra/sobreventa.


![Logotipo de "[Hamster-Coder] Pivot Points MTF"](https://cdn.ctrader.com/image/webp/4c143e5a-309c-40e3-a578-f04d1e133ffa_31159)


