
AlgoCorner McGinley Dynamic
Indicador
60 descargas
Versión 1.1, Jan 2026
Windows, Mac
Descripción
McGinley Dynamic es una de esas herramientas técnicas subestimadas que en realidad proviene de una observación muy práctica sobre los promedios móviles.
Fue creado por John R. McGinley, CMT, y su propósito principal es resolver los problemas comunes de los promedios móviles tradicionales — a saber, el retraso y los falsos cambios de dirección causados por las fluctuaciones en la velocidad del mercado.
Esto es lo que intenta abordar específicamente:
🧩 1. Retraso en los promedios móviles
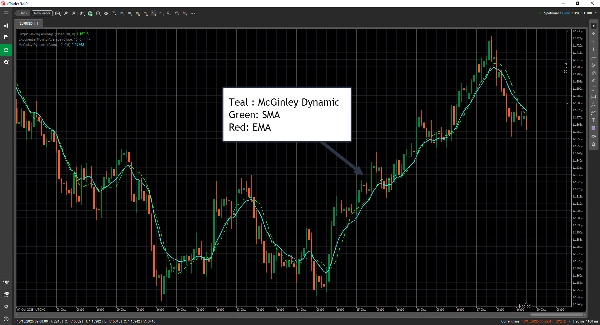
- Los promedios móviles regulares (SMA, EMA) se retrasan respecto al precio porque se basan en períodos fijos de retroceso.
- El McGinley Dynamic adapta automáticamente su suavizado según la velocidad del mercado.
Cuando el mercado se mueve rápidamente, acelera su ajuste; cuando el mercado desacelera, suaviza más suavemente.
👉 Resultado: sigue el precio más de cerca sin reaccionar en exceso.
🌪️ 2. Falsos cambios de dirección durante períodos volátiles
- Los promedios móviles tradicionales pueden dar señales falsas en mercados inestables.
- McGinley introdujo un denominador dinámico que se ajusta en proporción a la velocidad con la que se mueve el mercado.
Esto ayuda a reducir el ruido y evitar señales de cruce innecesarias.
⚙️ 3. Comportamiento más suave y autocorrectivo
- Actúa casi como un promedio móvil que se ajusta automáticamente, lo que significa que no necesitas ajustar tanto el período.
- Esto lo hace menos sensible a la entrada del usuario y a la volatilidad del mercado — una especie de promedio móvil “inteligente”.
Resumen
Resumen de IA
AlgoCorner McGinley Dynamic is a technical indicator designed to improve upon traditional moving averages by reducing lag and false signals. Created by John R. McGinley, CMT, it automatically adjusts its smoothing based on market speed, allowing it to track price movements more closely without overreacting. The indicator employs a dynamic denominator that changes in proportion to market velocity, helping to minimize whipsaws and avoid unnecessary crossover signals during volatile or choppy market conditions. Acting as a self-correcting, auto-adjusting moving average, it requires less fine-tuning of parameters and is less sensitive to market volatility and user input. This makes it a practical tool for traders seeking a smoother, more responsive moving average that adapts naturally to changing market dynamics. It is applicable to Forex markets, including currency pairs such as EURUSD and GBPUSD.
Perfil del indicador
Valoraciones de clientes
0.0
Valoraciones: 0
Valoraciones de clientes
Este producto todavía no se ha valorado. ¿Ya lo ha probado? Sea el primero en informar a otros.
Conversación
Preguntas frecuentes
Forex
EURUSD
GBPUSD
Los productos disponibles a través de cTrader Store, incluidos bots, indicadores y plugins para operar, son proporcionados por desarrolladores de terceros y están disponibles únicamente con fines informativos y de acceso técnico. cTrader Store no es un bróker, por lo que no proporciona asesoramiento de inversión, recomendaciones personales ni ninguna garantía de rentabilidad futura.


Precio
11
Ventas
353
Instalaciones gratis