
AlgoCorner Crosshair Edge
Indicador
Versión 1.0, Apr 2025
Windows, Mac
5.0
Valoraciones: 1
Descripción
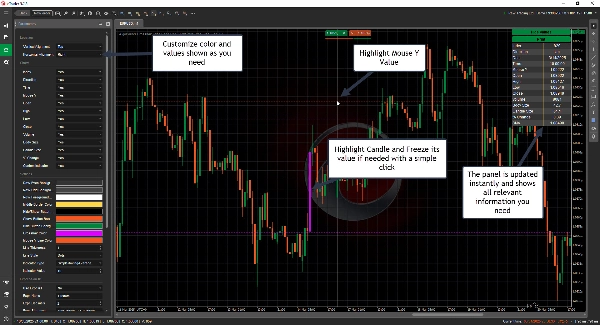
Crosshair Edge: La mejor herramienta de visualización de datos para cTrader
Con Crosshair Edge, una herramienta robusta que mejora la visualización de datos del mercado dentro de la plataforma cTrader, puedes elevar tu análisis de gráficos a nuevas alturas.
Interacción mejorada con el gráfico
- Resaltar la barra actual y su rango
- Congelar la cruz en una vela específica con un clic, y desbloquearla nuevamente con otro clic cuando sea necesario
- Enviar valores a tu registro para que puedan copiarse fácilmente
- Mostrar u ocultar el diseño según sea necesario
Personalización completa
- Personaliza los colores a tu estilo
- Ajusta la cruz a cualquier ubicación que necesites dentro del gráfico
- Selecciona qué valores se muestran y cuáles deben omitirse
Visualización instantánea de datos de la vela
Simplemente pasa el cursor sobre cualquier vela para ver todos sus detalles y más
- Índice
- Dirección
- Fecha
- Hora
- Precio Y del ratón
- Apertura
- Alto
- Bajo
- Cierre
- Volumen
- Tamaño del cuerpo
- Tamaño de la vela
- % Cambio
- Múltiples valores de indicadores
-
- ADX
- ATR
- Flujo de dinero Chaikin
- EMA, HMA, SMA, TSMA, TMA, WMA
- Volumen en balance
- RSI
- STD
- Cierre ponderado
- Suavizado Welles Wilder
- Williams %R
- Dibuja líneas horizontales/verticales con teclas rápidas fáciles
-
- Dibujar línea horizontal: Ctrl + 1
- Dibujar línea vertical: Ctrl + 2
- Teclas rápidas totalmente personalizables
- Fórmulas personalizables
-
- Usa Apertura, Alto, Bajo, Cierre e Índice para calcular fórmulas que se adapten a tus necesidades
- Ejemplo, Precio típico: (Alto[indice] + Bajo[indice] + Cierre[indice])/3.0
Integración sin interrupciones
- Licencia vinculada a tu ID de cTrader para facilitar su uso
- Actualizaciones futuras incluidas
¡Mejora tu experiencia de trading con Crosshair Edge hoy! 🚀
Resumen
Perfil del indicador
Valoraciones de clientes
5.0
Valoraciones: 1
5 | 100 % | |
4 | 0 % | |
3 | 0 % | |
2 | 0 % | |
1 | 0 % |
Valoraciones de clientes
Conversación
Preguntas frecuentes
Indices
RSI
ATR
Los productos disponibles a través de cTrader Store, incluidos bots, indicadores y plugins para operar, son proporcionados por desarrolladores de terceros y están disponibles únicamente con fines informativos y de acceso técnico. cTrader Store no es un bróker, por lo que no proporciona asesoramiento de inversión, recomendaciones personales ni ninguna garantía de rentabilidad futura.


Precio
10
Ventas
345
Instalaciones gratis