説明
VolumeProfileSuite は cTrader 用の高度で柔軟なボリュームプロファイルインジケーターです。
その主な目的は、異なる価格レベルでの出来高分布(すなわち、取引活動が行われた場所)を分析し、「価値」(高出来高)と「拒絶」(低出来高)の領域を特定することです。これにより、実際の市場活動に基づいた最も重要なサポートおよびレジスタンスレベルを見つけるのに役立ちます。
このインジケーターの特徴は、2つの強力な分析モードを1つのツールに統合し、Profile Mode パラメーターで選択可能にしている点です:
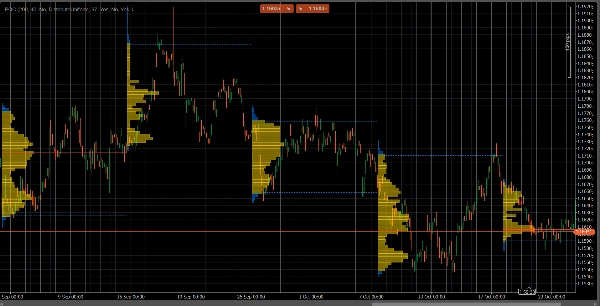
FixedRangeモード: マクロ分析に最適です。選択した単一の大きなブロック(例えば直近1000本のバーや特定の日付範囲、例:「先週全体」)を分析できます。主要な長期のサポート/レジスタンスレベルを見つけるのに理想的です。Periodicモード: マイクロおよび行動分析に最適です。自動的に「N」本ごと(例:100本ごと)に新しいプロファイルを描画します。これにより、POCとバリューエリアの時間的変化を確認し、市場の繰り返しパターンを研究できます。- パラメーターガイド(英語)
こちらは新しい統合されたVolumeProfileSuiteインジケーターの更新されたガイドです。このガイドは、選択したモードに基づいてどのパラメーターを使用し(または無視すべきか)を説明しているため非常に重要です。
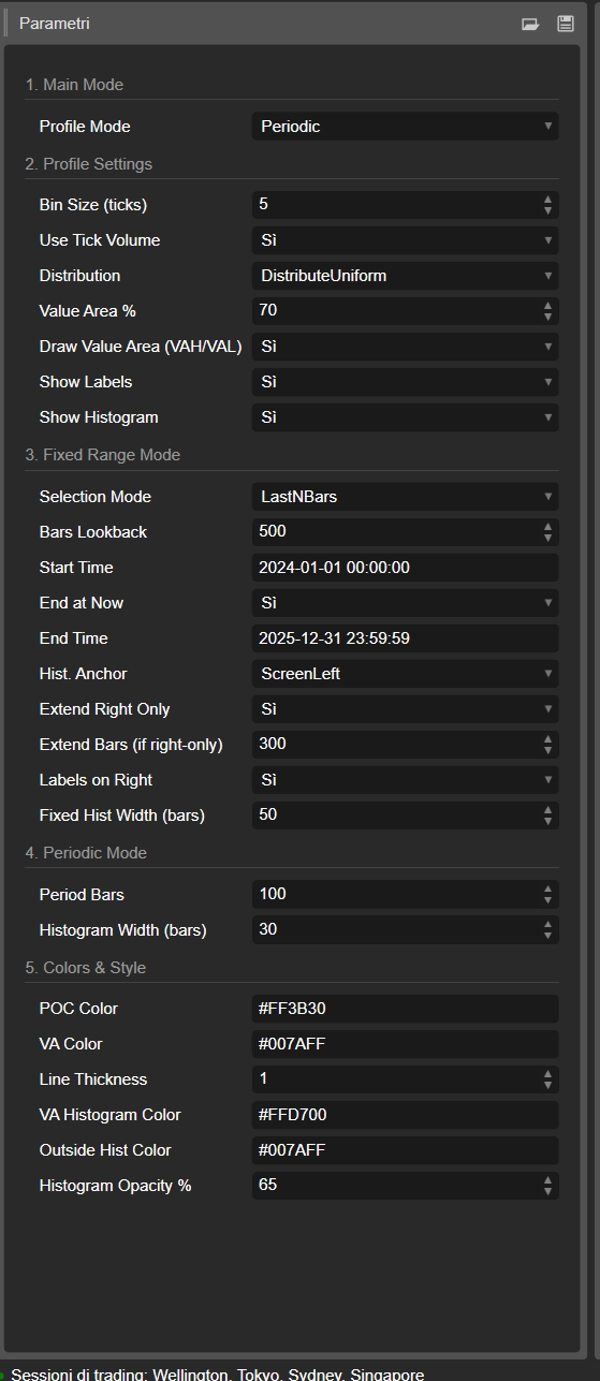
グループ1:メインモード
- Profile Mode: これは最も重要なパラメーターであり、マスタースイッチとして機能します。
-
FixedRange: 「単一ブロック」モードを有効にします。インジケーターは指定された1つの区間のみを分析します(グループ3の設定を使用)。Periodic: 「周期的」モードを有効にします。インジケーターは自動的にチャート全体をブロック単位で分析します(グループ4の設定に基づく)。
重要:
FixedRangeモードの場合、「グループ4:Periodic Mode」のすべてのパラメーターを無視してください。Periodicモードの場合、「グループ3:Fixed Range Mode」のすべてのパラメーターを無視してください。
グループ2:プロファイル設定
これらのパラメーターは共通であり、両方のモード(FixedRange と Periodic)に適用されます。
- Bin Size (ticks): プロファイルの垂直「解像度」を制御します。低い値(例:
1)は多くの細い価格行を作成します(非常に詳細)。高い値(例:10)は価格を太い行にまとめます(詳細度は低く、「滑らか」になります)。 - Use Tick Volume:
true(推奨)の場合、プロファイルは非常に正確な実際のティックボリュームを使用します。falseの場合は、単に各バーに「1」をカウントします。 - Distribution: バーの出来高の分布方法を定義します。
-
DistributeUniform(デフォルト):バーの出来高をその安値から高値まで触れたすべての価格レベルに「広げる」方法です。CloseOnly: バーの出来高をすべて終値の価格に割り当てます。
- Value Area %: 「バリューエリア」(最も取引活動が多い領域)を構成する出来高の割合を設定します。値は
70(70%)が市場標準です。 - Draw Value Area (VAH/VAL):
trueの場合、バリューエリア高値(VAH)とバリューエリア安値(VAL)の水平線を描画します。 - Show Labels:
trueの場合、「POC」「VAH」「VAL」のテキストラベルを表示します。(注意:Periodicモードではチャートが混雑する可能性があります)。 - Show Histogram:
trueの場合、出来高ヒストグラム(水平バー)を描画します。
グループ3:固定範囲モード
⚠️ 「Profile Mode」がFixedRangeに設定されている場合のみ、これらのパラメーターを使用してください。
- Selection Mode: 単一ブロックを定義する方法を選択します。
-
DateRange: 特定の開始日時と終了日時を使用します。LastNBars: 直近のN本のバーを使用します。
- Bars Lookback: (
LastNBarsのみ)何本前まで分析するか(例:500)。 - Start Time / End at Now / End Time: (
DateRangeのみ)区間の開始と終了を定義します。 - Hist. Anchor: (
FixedRangeのみ)ヒストグラムのアンカー位置を定義します。 -
DateRangeStart: 区間の開始位置(画面外でも可)。ScreenLeft: 表示ウィンドウの左端。ScreenRight: 表示ウィンドウの右端(空白部分)。
- Fixed Hist Width (bars):
FixedRangeモードのヒストグラムの幅(バー数)。 - Extend Right Only:
trueの場合、POC/VAH/VALのラインは将来方向に延長されます。 - Extend Bars: (
Extend Right Onlyがtrueの場合のみ)ラインを延長するバー数。 - Labels on Right:
trueの場合、延長されたラインの右端に価格ラベルを配置します。
グループ4:周期モード
⚠️ 「Profile Mode」がPeriodicに設定されている場合のみ、これらのパラメーターを使用してください。
- Period Bars: このモードの重要なパラメーターです。各周期ブロックに含めるバー数を定義します(例:
100)。 - Max Periods to Draw: 🌟 安全パラメーター! これは描画する周期プロファイルの数を制限し、cTraderのクラッシュを防ぎます。
50は履歴が多くても最新の50プロファイルのみを描画することを意味します。 あまり高く設定しないでください(例:200以上)。さもないとcTraderがフリーズする可能性があります! - Histogram Width (bars): 各周期ブロックのヒストグラムの幅(バー数)。
グループ5:色とスタイル
これらのパラメーターは共通であり、両方のモードに適用されます。
- POC Color: コントロールポイントラインの色。
- VA Color: VAHおよびVALラインの色。
- Line Thickness: POC、VAH、VALラインの太さ。
- VA Histogram Color: バリューエリア内のヒストグラムバーの色(デフォルト: 黄色)。
- Outside Hist Color: バリューエリア外のヒストグラムバーの色(デフォルト: 青)。
- Histogram Opacity %: ヒストグラム全体の透明度(不透明度)。
概要
The indicator offers two primary modes selectable via the Profile Mode parameter:
1. FixedRange Mode: Enables macro-level analysis by focusing on a single user-defined interval, such as a specific date range or a set number of bars, to identify major long-term support and resistance levels.
2. Periodic Mode: Facilitates micro and behavioral analysis by automatically generating volume profiles for consecutive blocks of bars, allowing observation of how the Point of Control (POC) and Value Area evolve over time.
Common configurable settings include bin size (price resolution), volume distribution method (uniform or close-only), use of tick volume, value area percentage, and display options for value area lines, labels, and histograms. Each mode has dedicated parameters to define intervals, histogram placement, and extension of key levels.
Visual customization options cover colors and line thickness for POC, value area lines, and histogram bars. The tool supports analysis across various markets and symbols, including Forex, indices, commodities, and cryptocurrencies.


