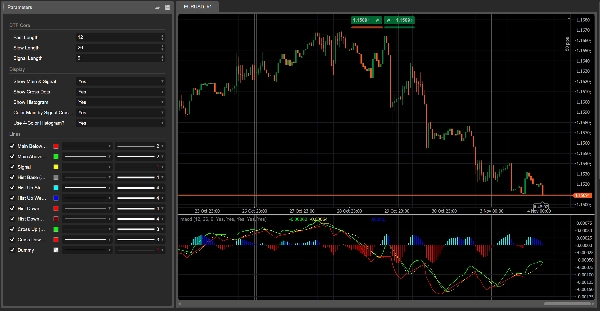
Brókeres y props
Para empresas
00
Days
:
00
Hours
:
00
Minutes
:
00
Seconds
Indicador
NAS100
NZDUSD
Martingale
Forex
Fibonacci
EURUSD
MACD
BTCUSD
SMC
Indices
ATR
Stocks
Grid
RSI
Breakout
XAUUSD
FVG
Commodities
Signal
Bollinger
GBPUSD
AI
VWAP
ZigZag
Prop
Supertrend
Crypto
USDJPY
Scalping
Dynamic Trend Flux
10/12/2025
Desktop
Desde 04/03/2025
Volumen operado
37.14M
Pips ganados
6.02M
Ventas
45
Instalaciones gratis
2455
Imagen cargada de "Dynamic Trend Flux"Imagen cargada de "Dynamic Trend Flux"

Dynamic Trend Flux
Type: Momentum / trend oscillator (MACD-style, multi-color)

What it does

Dynamic Trend Flux is a colored momentum oscillator based on the classic fast/slow EMA difference plus a signal line.
It helps you see at a glance:

  • when momentum is bullish or bearish,
  • whether momentum is strengthening or weakening,
  • and where trend shifts occur (crosses of main vs signal line).

The indicator draws:

  1. Main line (Flux line)
    • built from the difference between a fast and a slow EMA
    • changes color depending on whether it is above or below the signal line (optional).
  2. Signal line
    • a moving average of the main line, used as a smoother trigger.
  3. Histogram with 4 colors (optional)
    • shows the distance between main and signal,
    • color encodes both direction (above/below zero) and change of strength from bar to bar.
  4. Dots on crosses (optional)
    • highlights where the main line crosses the signal line → potential trend phase changes.

All calculations are performed on the current chart timeframe.


How to read it

1. Zero line

  • Values above zero → bullish pressure dominates.
  • Values below zero → bearish pressure dominates.

2. Colored histogram

With 4-color mode ON:

  • Aqua → above zero and rising
    • strong / increasing bullish momentum.
  • Blue → above zero but falling
    • bullish trend still on, but momentum cooling down.
  • Red → below zero and falling
    • strong / increasing bearish momentum.
  • Maroon → below zero but rising
    • bearish phase still on, but momentum losing strength.

This makes divergences and momentum shifts much easier to spot visually.

3. Main & Signal lines

  • Main line above Signal → bullish phase.
  • Main line below Signal → bearish phase.

If color-change is enabled:

  • Main line Lime = above Signal (bullish control)
  • Main line Red = below Signal (bearish control)

4. Cross dots

  • Green dot (Cross Up) → main crosses above signal
    • possible start of a bullish swing.
  • Red dot (Cross Down) → main crosses below signal
    • possible start of a bearish swing.

Always combine these signals with structure / price action and higher-timeframe context.


Parameters (English)

DTF Core

  • Fast Length – period of the fast EMA (default 12).
  • Slow Length – period of the slow EMA (default 26).
  • Signal Length – period of the signal SMA applied to the main line (default 9).

Display

  • Show Main & Signal – toggles the two lines.
  • Show Cross Dots – show dots on main/signal crossings.
  • Show Histogram – toggles the histogram behind.
  • Color Main by Signal Cross?
    • ON → main line Lime above signal, Red below.
    • OFF → main line stays Red.
  • Use 4-Color Histogram?
    • ON → aqua / blue / red / maroon logic.
    • OFF → histogram is a single gray color.
0.0
Valoraciones: 0
Valoraciones de clientes
Este producto todavía no se ha valorado. ¿Ya lo ha probado? Sea el primero en informar a otros.
Más de este autor
Indicador
NAS100
NZDUSD
Martingale
+26
Volume Delta
Read aggressive flow in real time. Flexible resets (Day/Week/Month), optional EMA smoothing, and non-repainting cumulati
cBot
NAS100
NZDUSD
Martingale
+26
Prop Ready Bot_v.2.0
The Prop-Ready Bot The Definitive Automaton for Challenges 🛡️ V2.0
cBot
NAS100
NZDUSD
Martingale
+26
ElliottWaveBot
N.B.: Results with an initial invested capital of 100 euros.
cBot
NAS100
NZDUSD
Martingale
+26
ElliottWave Pro cBot
The Elliott Wave Pro Bot is a sophisticated and highly configurable algorithmic trading system
Indicador
Grid
NZDUSD
XAUUSD
+16
vWAP Free
Editions: Free (core VWAP + bands) · Pro (multi‑VWAP, click‑to‑anchor, alerts).
cBot
Indices
RSI
Forex
+2
US 2000+MACD+ADR+ADMIR+RSI+MANY MORE-TF4M
N.B.: Results with an initial invested capital of 100 euros.
Indicador
NAS100
NZDUSD
Martingale
+26
Breakout channel
Breakout Channels automatically detects consolidation ranges and highlights when price breaks out of them.
cBot
NAS100
NZDUSD
Martingale
+26
Dynamic Trendline Deluxe Pro Cbot - PROP edition
Major Update Announcement: Advanced Prop Firm Risk Management is Here! 🚀
Indicador
NAS100
NZDUSD
Breakout
+14
ZIG ZAG Free
ZigZag Free is a clean swing-detection tool that marks significant pivot highs/lows
cBot
Grid
NAS100
RSI
+20
Breakout Premium Pro v2.0
A price-action-first algorithm to trade Breakout, Approach, and Return around prior High/Low levels—with Prop-style risk
Indicador
NAS100
NZDUSD
Martingale
+26
Volume Bubble
Volume Bubbles is a lightweight yet powerful visual indicator for cTrader
Indicador
ZigZag
Indices
Breakout
+1
Auto Tools Suite
Auto Trendlines, Fibonacci, Pitchfork and Patterns from non‑repainting pivots. One‑click Presets, targeted Alerts, and a
Indicador
Grid
NAS100
NZDUSD
+15
EMA UP&DOWN 2025
SectorIndex Dual Moving Average Indicator: Your Market Compass 🧭
cBot
Indices
ATR
US500 LONG&SHORT TF 5M ALL SEASON!
🚀N.B.: Results with an initial invested capital of 100 euros.
Indicador
NAS100
NZDUSD
Martingale
+25
Volume Profile Suite trial7D
DEMO VERSION 7 DAYS VolumeProfileSuite is an advanced and flexible Volume Profile indicator for cTrader.
cBot
NAS100
Indices
XAUUSD
+7
COT Institutional Sentiment Bot
Institutional COT sentiment, automated position trading and full prop-firm style risk control – all in one cBot.
Indicador
NAS100
NZDUSD
Martingale
+26
Pattern Scanner
Patter Scanner all Chart Let your chart tell you when patterns appear
Indicador
NAS100
Breakout
XAUUSD
+14
Initial Range
Initial Range – Where the open writes the script.
Puede interesarle
DailyPivotPoints
Daily Pivot Points plots key support and resistance levels to guide precise trading decisions.
Indicador
Breakout
3 Bar Triangle by Linda Raschke
3 bar triangle = high below 2 day high, low above 2 day low
Indicador
NAS100
NZDUSD
XAUUSD
+10
VMM Average Median Trial
VMM Average Median - Advanced Median Indicator with Smart Trend Detection
Indicador
Indices
Stocks
Forex
+4
MACD Pro Trader
🚀 MACD Pro Trader – Advanced MACD with buy/sell signals, custom MAs & color-coded histograms for smarter trading! 📈🔥
TDI_Pro
Traders Dynamic Index (TDI) — Divergence Edition
Indicador
RSI
Breakout
XAUUSD
+7
Candle Strength Oscillator
The Candle Pressure Index is a powerful, user-friendly indicator that reveals hidden market pressure inside candles.
Indicador
Forex
Signal
Supertrend
CandleColourFlow EURCAD Demo 1.1 UPGRADE
Innovative indicator that highlights trend direction and momentum strength quickly and clearly on Forex charts.
Indicador
NAS100
NZDUSD
XAUUSD
+11
Volume Profile Pro
Visualize trading volume by price within any range, highlight POC and key value areas.
Indicador
Breakout
Fibonacci
Linear Regression Channel
Statistically-grounded trend channels via linear regression — clear trend & reversal zones.
VegaXLR - Fibonacci Bands
Customizable Dynamic Fibonacci Channels and Smart Alerts
Indicador
NAS100
NZDUSD
Breakout
+18
Volume Profile Pivot Box Range
Most advanced Volume Profile Pivot Box indicator — auto pivots, volume zones, smart candle coloring & SMC trading tool.
Indicador
RSI
ATR
Signal
+1
Trading Fusion Bars 2
This indicator works best as a trend-confirmation tool—wait for multiple signals!
Indicador
XAUUSD
Volume Profile Fixed Range - Pro
Professional Volume Profile Indicator - Shows volume distribution, POC, Value Areas & Buy/Sell pressure.
Time To Break Even Lite Version
This is the trial version of Time To Break Even, which help you time your trade entry.
Indicador
NAS100
NZDUSD
XAUUSD
+10
VMM Average Median
VMM Average Median - Advanced Median Indicator with Smart Trend Detection
Indicador
Breakout
ATR
Scalping
Trend Volatility Trail
A volatility-adaptive trend-following indicator that dynamically adjusts to market conditions.
Indicador
Indices
Stocks
Commodities
+2
Candlestick Signal Finder
Candlestick Signal Finder: cTrader indicator that automatically detects and color-codes key Japanese candlestick pattern