Descripción
Bounty Killa – el indicador que caza la liquidez de stop-loss antes que los grandes jugadores.
Bounty Killa es un indicador de cTrader diseñado para traders que aman operar cazas de stops / capturas de liquidez: esas velas que se disparan por encima de los máximos o por debajo de los mínimos, limpian stops y luego revierten en la dirección opuesta.
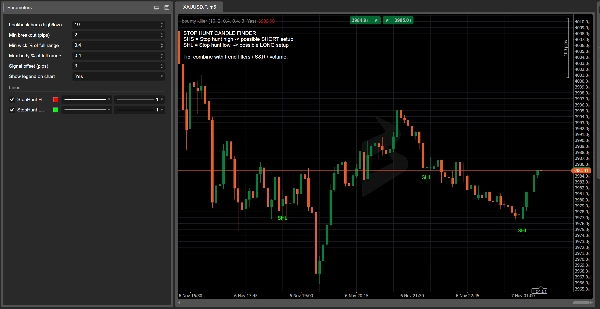
El indicador escanea automáticamente cada vela y marca:
- SHS (Stop Hunt High) – probable caza de stops por encima de máximos recientes → área para buscar configuraciones cortas
- SHL (Stop Hunt Low) – probable caza de stops por debajo de mínimos recientes → área para buscar configuraciones largas
La lógica de detección se basa en:
- romper máximos/mínimos recientes por al menos X pips,
- una mecha larga que se extiende más allá de ese nivel,
- un cuerpo pequeño y un cierre en la dirección opuesta al rompimiento.
No más adivinanzas “quizás esto fue una caza de stops”: Bounty Killer resalta las velas clave directamente en tu gráfico, con etiquetas claras, colores y una leyenda en el gráfico.
Por qué a los traders les gusta:
- Muestra dónde el mercado pudo haber capturado liquidez y dónde una reversión cobra más sentido.
- Totalmente personalizable: ventana de retroceso, ruptura mínima en pips, porcentajes de cuerpo/mecha, desplazamiento de señal.
- Se combina perfectamente con el soporte/resistencia clásico, oferta y demanda, volumen, bloques de órdenes y conceptos SMC.
- Ideal para traders que siguen configuraciones basadas en liquidez pero quieren algo objetivo y basado en reglas en lugar de solo mirar a ojo.
⚠️ Bounty Killa no es un sistema de trading completo y no abre ni cierra operaciones.
Las velas marcadas son zonas de alta información que deben integrarse con tu propia estrategia, análisis de tendencia y gestión de riesgos.
Bounty Killa – Guía rápida de usuario (EN)
1. Mercados y marcos temporales recomendados
- Marcos temporales: H1, H4, D1
(TF más bajos como M1–M5 = mucho ruido, usar principalmente para estudio.) - Símbolos: índices, FX, cripto, acciones, commodities – donde sea que puedas añadir un indicador de cTrader.
2. Cómo leer las señales
- SHS – Stop Hunt High (etiqueta roja sobre la vela)
-
- El precio se dispara por encima de máximos recientes, crea una mecha superior larga, y cierra bajista.
- Idea: posible configuración corta tras un falso rompimiento y captura de liquidez por encima de los máximos.
- SHL – Stop Hunt Low (etiqueta verde debajo de la vela)
-
- El precio se dispara por debajo de mínimos recientes, crea una mecha inferior larga, y cierra alcista.
- Idea: posible configuración larga tras un falso rompimiento a la baja y captura de liquidez por debajo de los mínimos.
Bounty Killer no dice “compra/vende ahora”.
Resalta zonas de liquidez donde una reversión tiene más sentido.
3. Configuraciones base sugeridas
En los parámetros del indicador:
- Barras de retroceso (alto/bajo):
10–20
→ cuántas barras mirar hacia atrás para máximos/mínimos recientes. - Ruptura mínima (pips):
5–15pips
→ distancia mínima más allá del máximo/mínimo para contar como caza de stops. - % mínimo de mecha del rango total:
0.60–0.70
→ al menos 60–70% de la vela debe ser mecha en la dirección de la caza de stops. - % máximo de cuerpo del rango total:
0.25–0.35
→ cuerpo pequeño comparado con el rango total de la vela. - Desplazamiento de señal (pips):
3–5
→ solo visual, mueve la etiqueta SHS/SHL ligeramente lejos de la vela.
4. Estrategia simple de ejemplo
Filtro de tendencia (EMA 200):
- Añade una EMA 200 a tu gráfico.
- Solo cortos:
-
- Precio por debajo de la EMA 200
- Obtienes una señal SHS (caza de stops alta).
- Solo largos:
-
- Precio por encima de la EMA 200
- Obtienes una señal SHL (caza de stops baja).
Idea de entrada:
- Espera a que la vela de caza de stops cierre.
- Entra en la siguiente vela solo si el precio confirma:
-
- Para SHS: la siguiente vela rompe el mínimo de la vela SHS → considera un corto.
- Para SHL: la siguiente vela rompe el máximo de la vela SHL → considera un largo.
Stop loss:
- Para SHS (corto) → SL justo por encima del máximo de la vela SHS.
- Para SHL (largo) → SL justo por debajo del mínimo de la vela SHL.
Toma de ganancias:
- Apunta a al menos 1:1.5 o 1:2 R/R, o
- Usa máximos/mínimos cercanos de oscilación, soporte/resistencia o zonas de oferta/demanda como objetivos.
5. Notas de seguridad y lista rápida de verificación
Antes de usar una señal de Bounty Killer, pregunta:
- ¿Tendencia?
¿Está la señal alineada con la tendencia general (EMA 200 / estructura del mercado)? - ¿Nivel?
¿La caza de stops ocurre en un nivel significativo (máximo/mínimo previo, S/R, máximo/mínimo de sesión, etc.)? - ¿Contexto?
¿Alguna noticia, apertura/cierre de sesión, picos de volatilidad? - ¿Riesgo?
¿Está bien el tamaño de tu stop para tu gestión de dinero (máximo % por operación)?
Si 3–4 de estos puntos coinciden, el SHS/SHL de Bounty Killa no es solo “una vela bonita”, sino una zona de alto valor para construir una idea de trading alrededor.
Resumen
The detection criteria include a breakout beyond recent highs/lows by a configurable number of pips, a long wick extending beyond that level, a small candle body, and a close opposite to the breakout direction. Signals are displayed directly on the chart with clear labels and colors, supported by an on-chart legend.
Recommended for use on hourly to daily timeframes (H1, H4, D1) across various markets including forex, indices, cryptocurrencies, stocks, and commodities, Bounty Killa is fully customizable with parameters such as lookback period, minimum breakout size, wick and body proportions, and signal label offset.
The indicator highlights high-value liquidity zones to support trading decisions but does not execute trades. It is intended to be combined with other analysis tools like support/resistance, volume, order blocks, and trend filters (e.g., 200 EMA) for developing objective, rule-based liquidity-based trading setups.
Valoraciones de clientes
5 | 50 % | |
4 | 50 % | |
3 | 0 % | |
2 | 0 % | |
1 | 0 % |


