

Descripción
🚀 Risk Appetite & Directional Bias ULTRA (cTrader) es un indicador profesional de régimen de mercado diseñado para medir condiciones Risk-On / Neutral / Risk-Off y convertirlas en un claro y accionable sesgo direccional. En lugar de depender de un solo mercado, compara dos instrumentos (un “proxy de riesgo” y un “benchmark”) para construir un Puntaje de Riesgo (0–100) en tiempo real, resaltar transiciones de régimen y resumir todo mediante una pantalla de panel en el gráfico.
🔧 Qué significan los dos primeros parámetros (y por qué importan)
🟠 Símbolo del Activo de Riesgo (BTC)
Este es el proxy de riesgo—el instrumento usado como “termómetro del apetito de riesgo.” Está etiquetado como “BTC” porque el concepto original usa Bitcoin como proxy global de riesgo, pero no estás obligado a usar Bitcoin. Puedes configurarlo con cualquier activo que represente bien el sentimiento de riesgo (por ejemplo, BTC, NASDAQ/US100, índices de alta beta, etc.).
🔵 Símbolo de Referencia (SP/US500)
Este es el mercado de referencia (benchmark) que quieres seguir para el sesgo macro. Normalmente es US500/SPX500, pero puede ser cualquier instrumento que consideres tu “motor de contexto” principal.
✅ En resumen:
- Activo de Riesgo = sensor de sentimiento (fuente del apetito de riesgo)
- Benchmark = mercado de referencia que quieres que refleje el sesgo
❓ ¿Tengo que usarlo con Bitcoin?
No. Puedes usar el indicador de diferentes maneras según tu objetivo:
✅ A) Macro “clásico” Risk-On/Risk-Off (recomendado)
- Activo de Riesgo: BTCUSD
- Benchmark: US500 / SPX500
Esto ofrece una vista clara de los regímenes globales de riesgo.
✅ B) Operar Bitcoin con contexto macro
- Activo de Riesgo: BTCUSD
- Benchmark: US500 (u otra referencia macro)
Esto te ayuda a entender cuándo las condiciones macro apoyan o se oponen a BTC.
✅ C) Relaciones multi-activo / mercado personalizado
- Activo de Riesgo: BTC o US100
- Benchmark: el mercado que quieres filtrar (GER40, XAUUSD, etc.)
Esto convierte el indicador en un “motor de sentimiento” flexible.
⚙️ Cómo funciona (lógica central)
El modelo calcula lo siguiente en ambos símbolos:
📈 Retornos (%) (opcionalmente logarítmicos para mayor estabilidad)
📊 Volatilidad (desviación estándar sobre el periodo seleccionado)
🔗 Correlación móvil entre las dos series de retornos
🎛️ Peso Dinámico que ajusta la influencia del proxy de riesgo basado en:
- fuerza de correlación
- volatilidad relativa
Esto produce una señal de Cambio Ajustado que es:
- suavizada con EMA
- normalizada en un Puntaje de Riesgo 0–100
📊 Cómo leerlo (las señales más importantes)
🎯 Puntaje de Riesgo (0–100) es tu brújula principal:
🟢 Risk-On (puntaje por encima del umbral superior, por ejemplo, > 60)
→ el apetito de riesgo es fuerte, el entorno suele favorecer activos de momentum/riesgo
🔵 Neutral (entre los umbrales inferior y superior, por ejemplo, 40–60)
→ transición / rango / señales mixtas, se recomienda filtrar
🔴 Risk-Off (puntaje por debajo del umbral inferior, por ejemplo, < 40)
→ entorno defensivo, mayor precaución, el riesgo a la baja suele ser elevado
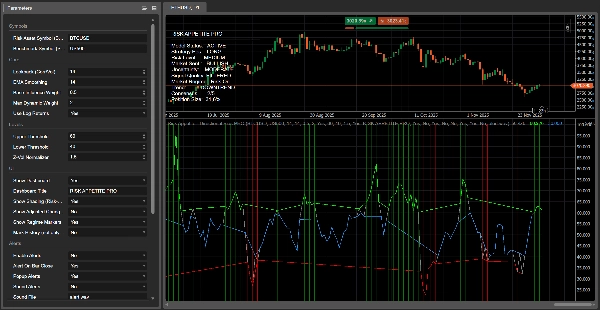
🔴 Por qué la línea roja “se rompe” (y qué significa)
En esta versión ULTRA la visualización es intencional y “basada en regímenes”:
- Una línea base continua (gris) siempre está visible
- Las superposiciones de color aparecen solo en su régimen:
-
- Superposición roja solo durante Risk-Off
- Superposición verde solo durante Risk-On
- Superposición azul durante Neutral
Así que cuando el mercado sale de Risk-Off y pasa a Neutral (o Risk-On), la superposición roja se vuelve vacía (NaN) y cTrader deja de dibujarla—por eso parece que “se interrumpe.” ✅
📌 Importante: esto no significa automáticamente que la tendencia bajista haya “terminado.”
Significa que el modelo ya no detecta condiciones fuertes y confirmadas de Risk-Off, por lo que la ventaja bajista se reduce y el mercado probablemente está en transición.
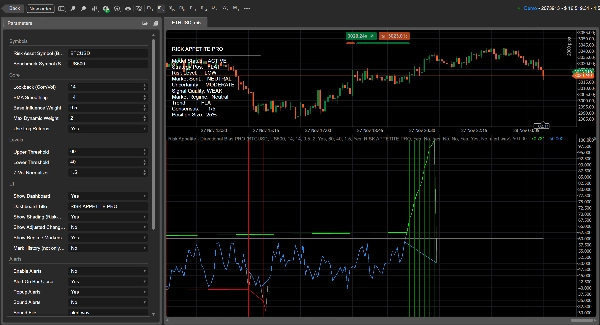
🖥️ Para qué sirve la pantalla en el gráfico (panel) — explicado línea por línea
El panel es tu panel de decisiones en tiempo real. Resume régimen, confianza y guía táctica para que no tengas que adivinar solo con la línea.
✅ Estado del Modelo
Indica si el modelo está funcionando correctamente.
- ACTIVO = datos válidos disponibles y cálculos correctos
- SIN DATOS = datos del símbolo faltantes, nombre de símbolo incorrecto o historia/alineación temporal insuficiente
🎯 Posición Estrategia (Strategy Position)
Una postura sugerida basada en el régimen:
- LARGO = Risk-On
- CORTO = Risk-Off
- NEUTRO = Neutral
⚠️ Nivel de Riesgo
Una medida de intensidad de riesgo basada en la volatilidad y la incertidumbre del mercado.
- MUY BAJO / BAJO = condiciones más estables
- MEDIO = normal
- ALTO / MUY ALTO = mayor ruido, mayor riesgo de whipsaw; reduce tamaño o exige confirmación más fuerte
🧠 Sentimiento del Mercado
Un tono direccional derivado del nivel del puntaje:
- ALCISTA / BAJISTA / NEUTRO
🌫️ Incertidumbre
Muestra qué tan “claro” está el modelo. Aumenta cuando:
- la correlación se debilita, o
- la volatilidad sube (entorno más inestable)
Niveles: BAJO / MODERADO / ALTO
🧪 Calidad de la Señal
Una calificación combinada basada en:
- fuerza de la señal (distancia desde 50)
- nivel de incertidumbre
Resultados: FUERTE / FILTRADA / DÉBIL
🔥 Régimen de Mercado
La clasificación principal:
- Risk-On / Neutral / Risk-Off
Este es el estado central del régimen que impulsa las superposiciones de color, sombreado y sesgo de posición.
📉 Tendencia
La dirección a corto plazo del puntaje (pendiente):
- TENDENCIA ALCISTA = aumento del apetito de riesgo
- TENDENCIA BAJISTA = disminución del apetito de riesgo
- PLANO = lateral / bajo momentum
🗳️ Consenso (X/5)
Un puntaje simple de alineación que cuenta cuántas condiciones clave coinciden (dirección, pendiente, alineación de correlación, etc.).
Mayor = entorno más claro y consistente.
📏 Tamaño de Posición
Un porcentaje de exposición sugerido basado en la fuerza de la señal y la incertidumbre:
- fuerte y baja incertidumbre → sugerencia de tamaño mayor
- débil o incierto → sugerencia de tamaño menor
🧭 Ventaja multi-marco temporal (muy poderoso en la práctica)
Cuando analizas el mismo mercado a través de múltiples marcos temporales, el indicador se actualiza y realinea por marco temporal. Esto facilita detectar:
✅ Alineación de marcos temporales (señales más fuertes)
✅ Conflicto de marcos temporales (a menudo condiciones más neutrales/inestables)
Los marcos temporales más altos definen el régimen macro, los marcos más bajos ayudan con la sincronización de entradas dentro de ese régimen.
📌 Marcadores, alertas y notificaciones (funciones ULTRA)
✨ Marcadores de régimen se imprimen en el gráfico cuando cambia el régimen:
- Risk-On ↔ Neutral ↔ Risk-Off
Esto hace que las transiciones sean instantáneamente visibles.
🔔 Alertas y notificaciones pueden activarse para que recibas:
- alertas emergentes (y sonido opcional)
- alertas al cierre de barra (recomendado para evitar activaciones falsas mientras se forma la vela)
💬 Únete a nuestro (optimizaciones + presets + herramientas)
¿Quieres el mejor rendimiento de este indicador? Únete a nuestro Discord para:
✅ optimización de parámetros para los símbolos de tu broker
✅ presets listos para usar (Crypto / Índices / FX)
✅ guía para configuración multi-marco temporal
✅ herramientas avanzadas y actualizaciones que mejoran el filtrado de señales y la calidad de ejecución
Resumen
Valoraciones de clientes
5 | 100 % | |
4 | 0 % | |
3 | 0 % | |
2 | 0 % | |
1 | 0 % |


![Logotipo de "[Hamster-Coder] Bollinger Bands"](https://cdn.ctrader.com/image/webp/21d8e5d6-fb11-4bac-b9ee-cd05c2b76804_30327)


