
STC
Indicador
278 descargas
Versión 1.0, Jan 2025
Windows, Mac
5.0
Valoraciones: 2
Descripción
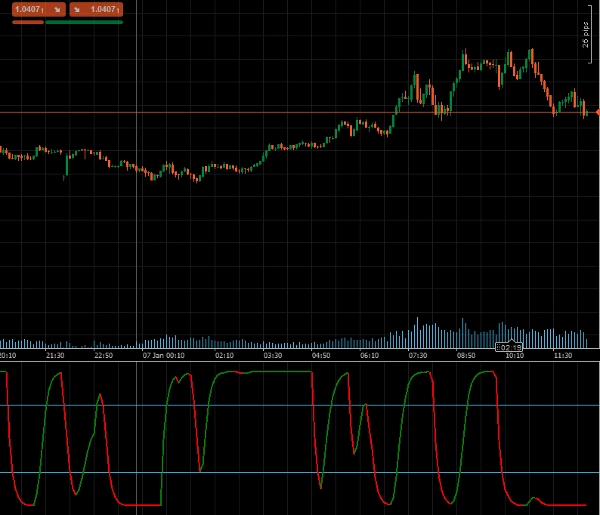
El Schaff Trend Cycle (STC), desarrollado por el renombrado analista técnico Doug Schaff, es un indicador avanzado de trading diseñado para identificar tendencias y reversiones del mercado con una velocidad y precisión excepcionales. Basado en la idea innovadora de combinar componentes de tendencia y ciclo, el STC utiliza medias móviles exponenciales (EMAs) y cálculos estocásticos para superar las limitaciones de indicadores rezagados como MACD o el Oscilador Estocástico. Este enfoque único proporciona señales de trading más tempranas y confiables, ofreciendo una ventaja significativa en la detección de tendencias y el análisis del mercado.
Características clave:
- Detección temprana de tendencias: Combina medias móviles exponenciales (EMAs) con cálculos estocásticos para captar tendencias más rápido.
- Configuraciones personalizables: Ajusta la longitud, MA rápida, MA lenta, tipo de MA y factor de suavizado para adaptarse a tu estrategia de trading.
- Alertas visuales: Cambios dinámicos de color indican tendencias alcistas o bajistas, facilitando la interpretación de las condiciones del mercado.
- Soporte para niveles de sobrecompra/sobreventa: Niveles incorporados (25 y 75) ayudan a identificar posibles puntos de inflexión del mercado.
Parámetros
- Longitud: Define el número de períodos para el cálculo de la tendencia.
- Longitud MA rápida: Establece la longitud de la media móvil rápida.
- Longitud MA lenta: Especifica la longitud de la media móvil lenta.
- Tipo de MA: Permite seleccionar el tipo de media móvil (por ejemplo, EMA, SMA).
- Factor de suavizado: Ajusta el factor de suavizado para señales de tendencia más refinadas.
Salidas
- STC: Proporciona el valor principal del Schaff Trend Cycle, que representa la dirección y fuerza de la tendencia, para uso programático en sistemas de trading automatizados.
- STCBull: Destaca condiciones de tendencia alcista.
- STCBear: Destaca condiciones de tendencia bajista.
Resumen
Perfil del indicador
Valoraciones de clientes
5.0
Valoraciones: 2
5 | 100 % | |
4 | 0 % | |
3 | 0 % | |
2 | 0 % | |
1 | 0 % |
Valoraciones de clientes
August 12, 2025
Pros: Fast and accurate trend detection, earlier signals than MACD, customizable levels. Cons: No alerts, no MTF mode, no trade statistics.
Conversación
Preguntas frecuentes
MACD
Los productos disponibles a través de cTrader Store, incluidos bots, indicadores y plugins para operar, son proporcionados por desarrolladores de terceros y están disponibles únicamente con fines informativos y de acceso técnico. cTrader Store no es un bróker, por lo que no proporciona asesoramiento de inversión, recomendaciones personales ni ninguna garantía de rentabilidad futura.
Más de este autor


Precio
Desde 24/09/2024
4.46K
Instalaciones gratis