
説明
🚀 cTrader用ボリュームプロファイルプロ
価格変動の背後にある真の構造を解き明かす Volume Profile Pro は、プロのcTraderトレーダー向けに設計された強力で完全にカスタマイズ可能な価格別ボリュームインジケーターです。
この高度なツールは 選択した時間枠ごとの個別のボリュームプロファイル を視覚化し、チャート内で機関投資家の活動がどこに集中しているかを正確に把握できます。
🔎 機能概要
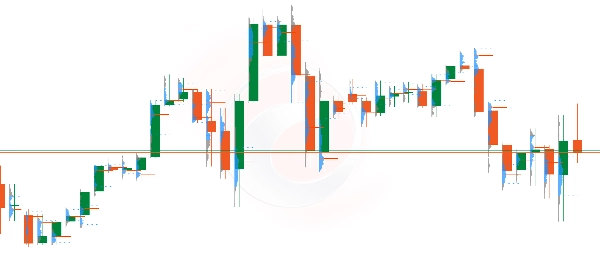
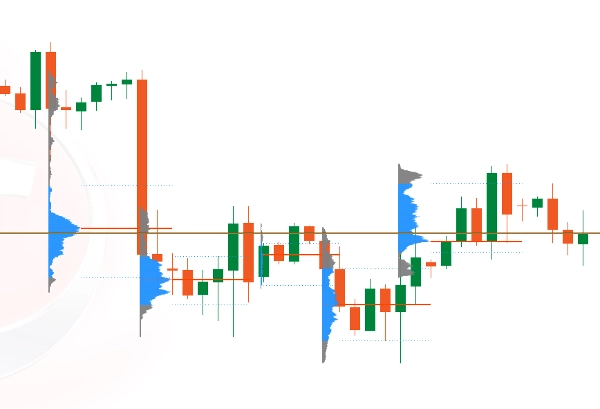
Volume Profile Proは各完了した期間(H1、M15、D1など)ごとに 固定範囲のボリューム分布 を計算し、価格軸上に直接プロットして正確な構造分析を可能にします。
各プロファイルは:
- 期間ごとに個別に描画されます
- 一貫した固定価格範囲を使用します
- 価格レベルごとのボリューム分布を表示します
- 主要な機関レベルを強調表示します
プロファイルは各ローソク足の 左側にきれいに配置され、価格変動を妨げることなく明確な構造認識を保証します。
⚡ 主な特徴
✔ 時間枠ごとの個別ボリュームプロファイル
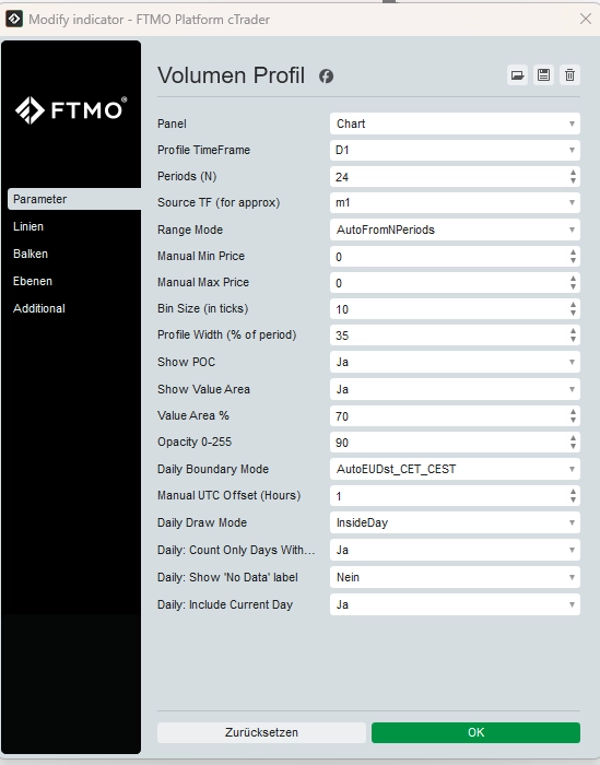
✔ 選択可能なプロファイル時間枠(M15、H1、H4、D1など)
✔ 固定価格範囲(自動または手動)
✔ コントロールポイント(POC)強調表示
✔ バリューエリア高値(VAH)&バリューエリア安値(VAL)
✔ チャートのちらつきなしのスムーズなレンダリング
✔ パフォーマンスに完全最適化
✔ CFDおよびティックボリューム環境向けに設計
📊 トレーダーが使う理由
- 機関の蓄積および分配ゾーンを特定する
- 高確率の反応レベルを見つける
- ブレイクアウトの強さを確認する
- レンジ内のエントリーを洗練する
- ボリューム構造を価格変動と整合させる
スキャルパー、日中トレーダー、スイングトレーダーのいずれであっても、Volume Profile Proは構造的な優位性を提供します。
⚠ 重要な免責事項
Volume Profileは取引ソフトウェアツールであり、 金融または投資のアドバイスを構成するものではありません。
外国為替、CFD、その他の金融商品を取引することは大きなリスクを伴い、資本の損失を招く可能性があります。
🎯 精度のために作られ、プロフェッショナルのために設計されました。
市場構造分析を次のレベルに引き上げ、明確さ、自信、コントロールを持って取引しましょう。
概要
カスタマーレビュー
5 | 100 % | |
4 | 0 % | |
3 | 0 % | |
2 | 0 % | |
1 | 0 % |