
VolumeRenkoRange
Indicador
1.4K descargas
Versión 1.1, Jan 2026
Windows, Mac
5.0
Valoraciones: 1
Descripción
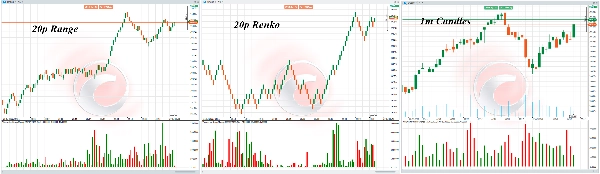
VolumeRenkoRange aplica la lógica de volumen de ticks en gráficos basados en precio.
Utiliza datos de ticks para calcular el volumen, al igual que las velas.
Es posible porque tenemos la hora de apertura/cierre de la barra, así que:
Lógica de volumen = Número de actualizaciones de precio (ticks) durante la formación de la barra (entre OpenTime y CloseTime).
¿Qué hay de nuevo en la rev.1?
Incluye todas las mejoras relacionadas con "Order Flow Aggregated"
- VolumeTick() de alto rendimiento
- Recolección asíncrona de datos de ticks
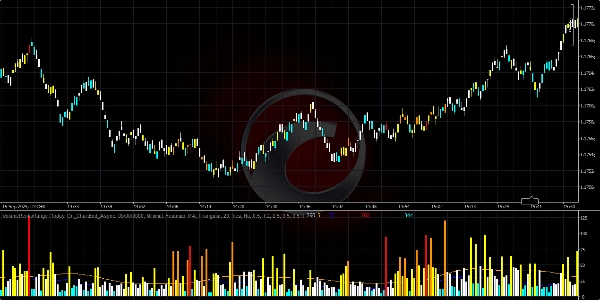
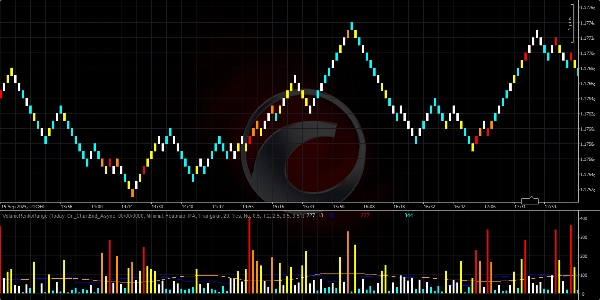
- Coloreado tipo heatmap/desvanecimiento
Resumen
Resumen de IA
VolumeRenkoRange is an indicator designed for price-based charts such as Renko and Range charts. It applies tick volume logic by calculating the number of price updates (ticks) that occur during the formation of each bar, using the bar's open and close times. This approach enables volume measurement on non-time-based charts similarly to traditional candlestick charts. The indicator incorporates high-performance tick volume calculation, asynchronous tick data collection, and visual enhancements like heatmap and fading coloring to represent volume intensity. It is part of a suite of cTrader Store indicators focused on order flow and volume analysis.
Perfil del indicador
Valoraciones de clientes
5.0
Valoraciones: 1
5 | 100 % | |
4 | 0 % | |
3 | 0 % | |
2 | 0 % | |
1 | 0 % |
Valoraciones de clientes
July 9, 2025
Pros: Displays volume-based Renko blocks, filtering noise and highlighting impulsive moves. Flexible settings, stable performance. Cons: No tooltips or alerts. No template saving. Requires additional confirmation tools for reliable trading decisions.
Conversación
Preguntas frecuentes
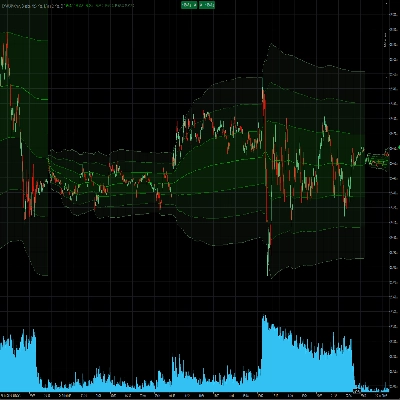
VWAP
Los productos disponibles a través de cTrader Store, incluidos bots, indicadores y plugins para operar, son proporcionados por desarrolladores de terceros y están disponibles únicamente con fines informativos y de acceso técnico. cTrader Store no es un bróker, por lo que no proporciona asesoramiento de inversión, recomendaciones personales ni ninguna garantía de rentabilidad futura.


Precio
Desde 12/12/2024
1
Ventas
33.19K
Instalaciones gratis