
Descripción
RiskLotSizer es un indicador de gestión de riesgo y tamaño de posición basado en gráficos para cTrader, diseñado para ayudar a los traders a calcular rápidamente y de forma visual el tamaño adecuado de la operación.
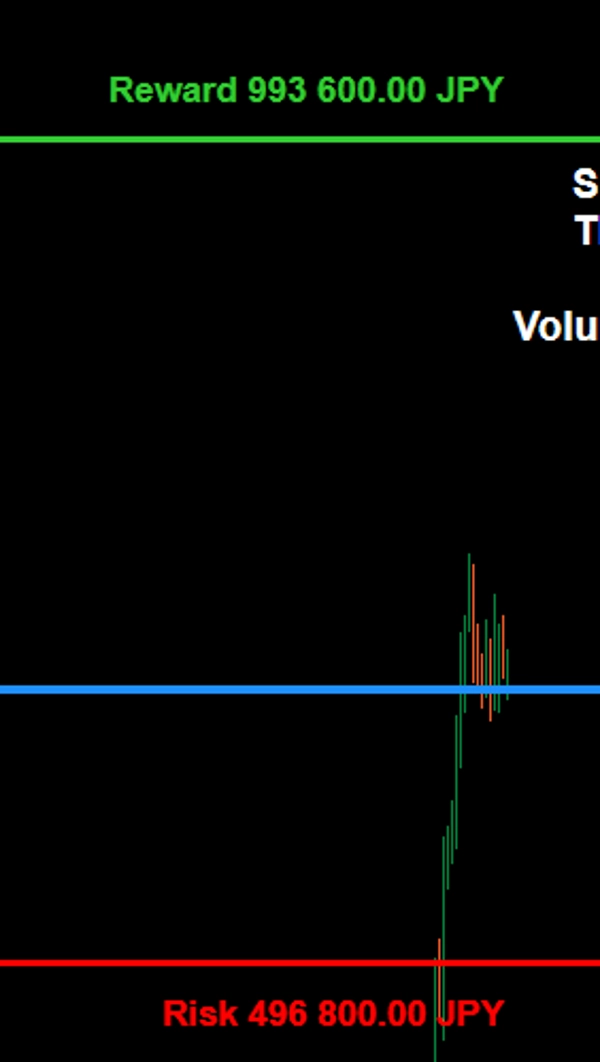
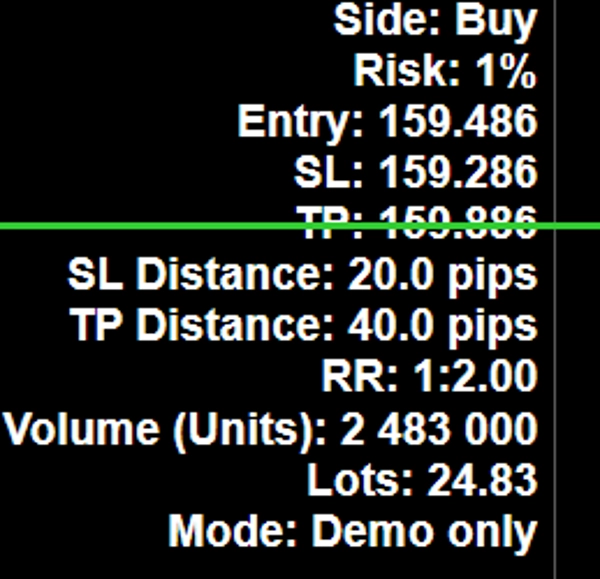
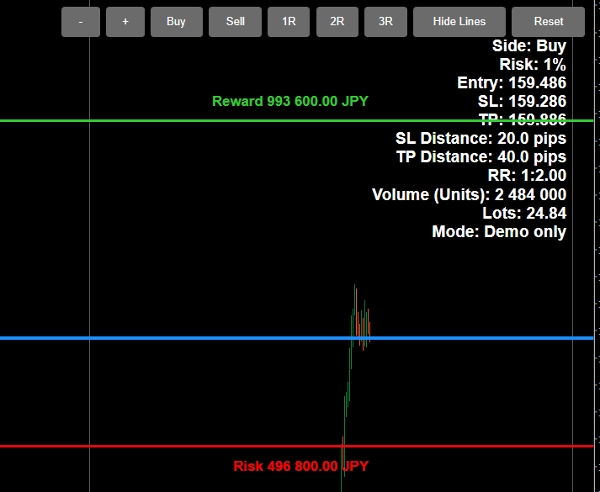
El indicador permite ajustar los niveles de Entrada, Stop Loss y Take Profit directamente en el gráfico, facilitando la planificación de operaciones en tiempo real. Basado en el porcentaje de riesgo seleccionado del capital de la cuenta, RiskLotSizer calcula automáticamente el tamaño de la posición y muestra el tamaño estimado del lote, la cantidad de riesgo, la cantidad de recompensa y la relación riesgo/recompensa.
Soporta escenarios tanto de Compra como de Venta y está diseñado para ofrecer a los traders una visión clara y visual del riesgo de la operación antes de entrar en una posición. Los valores de riesgo y recompensa se muestran directamente cerca de las líneas SL y TP, mientras que el panel principal de información proporciona un resumen limpio de la configuración.
Las características clave incluyen:
- Cálculo del tamaño del lote basado en un porcentaje elegido del capital
- Líneas ajustables de Entrada, SL y TP directamente en el gráfico
- Visualización en tiempo real del tamaño de la posición, cantidad de riesgo, cantidad de recompensa y RR
- Soporte para modos tanto de Compra como de Venta
- Botones preestablecidos de RR para una planificación de operaciones más rápida
- Soporte de idiomas inglés y japonés
- Alternar visibilidad de líneas para un gráfico más limpio cuando sea necesario
RiskLotSizer es ideal para traders discrecionales, traders diarios y cualquiera que desee una forma más rápida y clara de dimensionar posiciones mientras mantiene un control de riesgo consistente.
RiskLotSizer は、チャート上で直感的にポジションサイズを計算できる cTrader 用のポジションサイジング・リスク管理インジケーターです。
Entry、Stop Loss、Take Profit の各ラインをチャート上で直接動かしながら、指定した有効証拠金比率に基づく適正ロット数を自動計算します。これにより、トレード前に必要なロット数、想定損失額、想定利益額、Risk/Reward をリアルタイムで把握できます。
Buy / Sell の両方に対応しており、RR プリセットボタンによって利確目標の調整も素早く行えます。また、SL・TP 付近には損失額・利益額が表示されるため、視覚的にも分かりやすく、実践的なトレード設計をサポートします。
主な特長:
- 有効証拠金に対する指定リスク率からロット数を自動計算
- Entry / SL / TP をチャート上で直接調整可能
- ロット数、損失額、利益額、RR をリアルタイム表示
- Buy / Sell の両方に対応
- RR プリセットボタン搭載
- 英語 / 日本語切替対応
- 必要に応じてライン表示の ON / OFF が可能
RiskLotSizer は、裁量トレーダー、デイトレーダー、そして一貫したリスク管理を重視するトレーダーに適したインジケーターです。
Resumen
Valoraciones de clientes
5 | 0 % | |
4 | 100 % | |
3 | 0 % | |
2 | 0 % | |
1 | 0 % |