
Descrição
VoltyBands é um indicador adaptativo baseado em volatilidade que acompanha dinamicamente o comportamento do preço e visualiza as condições do mercado por meio de bandas superior e inferior responsivas. Diferentemente dos indicadores de canal estáticos, o VoltyBands ajusta-se em tempo real para refletir mudanças na volatilidade, ajudando os traders a entender melhor as fases de expansão e contração do preço.
Ao combinar cálculos adaptativos das bandas com uma linha de sinal suavizada opcional, o VoltyBands fornece uma estrutura clara para analisar o momentum, identificar zonas potenciais de reversão e detectar períodos de consolidação.
Principais Características
- Bandas de Volatilidade Adaptativas
As bandas se expandem e contraem automaticamente com base na atividade atual do mercado. - Modo Centralizado no Zero
Opção para exibir o movimento do preço em relação a uma linha base central para maior clareza. - Opção de Normalização
Permite uma escala consistente, facilitando a comparação de sinais entre diferentes instrumentos e períodos. - Média Móvel Integrada
Suavização incorporada com métodos selecionáveis (SMA, EMA, SMMA, LWMA). - Exibição Personalizável
Linha do meio opcional e configurações flexíveis de visualização.
Como Usar
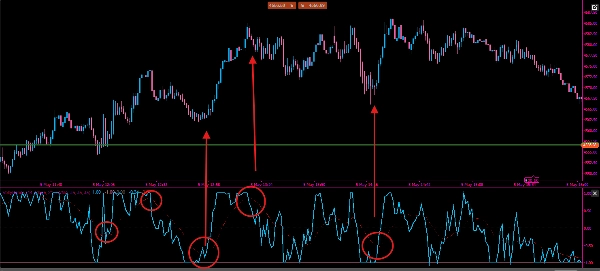
- Detecção de Momentum
O preço se aproximando da banda superior pode indicar força de alta, enquanto a proximidade da banda inferior sugere pressão de baixa. - Zonas de Reversão
Desvios extremos da linha central podem destacar áreas onde o preço pode reverter. - Análise de Volatilidade
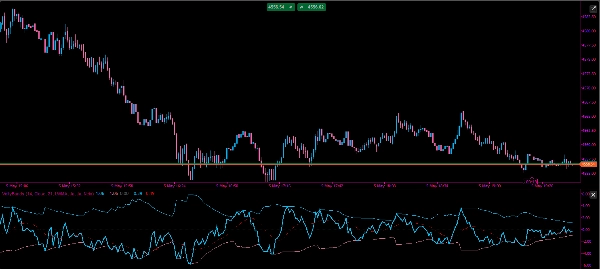
Bandas que se alargam indicam aumento da volatilidade; bandas que se estreitam sugerem consolidação. - Confirmação de Sinal
Use a média móvel como filtro adicional para entradas ou saídas.
Parâmetros
- Comprimento – Define a sensibilidade do cálculo da volatilidade
- Fonte – Preço de entrada (Fechamento, Abertura, etc.)
- Período da MA – Período para a linha de suavização
- Método da MA – Tipo de média móvel (SMA, EMA, SMMA, LWMA)
- Mostrar Meio – Alternar a linha central
- Vincular ao Zero – Ativar visualização baseada no zero
- Normalizar – Ativar escala normalizada
Uso Prático
O VoltyBands pode ser usado para avaliar tanto o momentum quanto a estrutura do mercado em tempo real. Quando o preço permanece próximo à banda superior, sugere pressão de alta sustentada, enquanto a interação consistente com a banda inferior indica condições de baixa.
Em mercados laterais, os traders podem buscar o movimento do preço entre as bandas, usando os níveis externos como áreas potenciais para reversão à média. Em contraste, durante tendências fortes, o preço pode “seguir” um lado da banda, sinalizando continuação em vez de reversão.
A linha do meio pode servir como um nível dinâmico de equilíbrio. Cruzamentos acima ou abaixo dessa linha podem ser usados como indicações direcionais, especialmente quando combinados com a média móvel incorporada para confirmação.
No modo normalizado, os valores podem ser interpretados como extremos relativos, facilitando a identificação de condições sobreextendidas independentemente do instrumento ou período.
Como qualquer indicador, o VoltyBands é mais eficaz quando usado junto com a ação do preço e ferramentas adicionais de confirmação.