


Description
Ce que cela fait
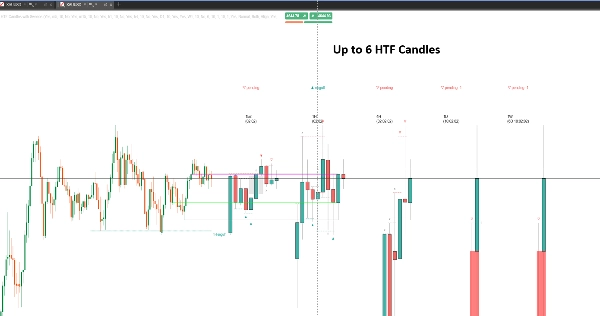
HTF Candles with Sweeps affiche jusqu'à six unités de temps supérieures sous forme de vraies chandelles à côté de votre graphique — 5m, 15m, 1H, 4H, Daily, Weekly, ou toute résolution que vous choisissez — afin que l'histoire de l'unité de temps supérieure soit à côté du prix que vous tradez plutôt qu'à un changement de graphique.
Au-dessus de ces chandelles, il détecte les balayages de liquidité : une chandelle qui traverse un plus haut ou un plus bas derrière elle pour prendre les ordres qui y reposent. La plupart des outils s'arrêtent à signaler le pic. Celui-ci suit ce qui se passe ensuite, car un balayage qui est récupéré et un balayage qui se transforme en cassure signifient des choses opposées.
Le panneau des unités de temps supérieures
Six emplacements indépendants, chacun avec sa propre unité de temps, nombre de chandelles et couleurs. Chaque ensemble dessine avec des corps et mèches corrects, un compte à rebours en direct jusqu'à la prochaine clôture, et des étiquettes d'unité de temps au-dessus et en dessous.
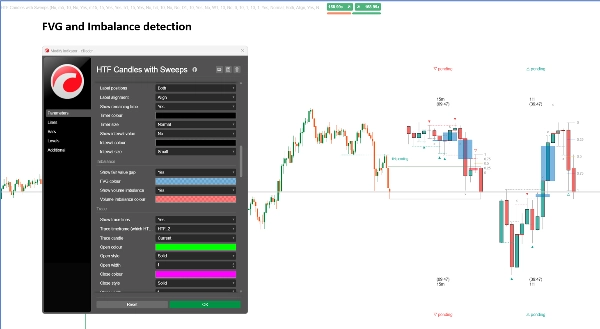
Entre les chandelles dessinées, le panneau marque aussi les gaps de juste valeur et les déséquilibres de volume — les mêmes déséquilibres que vous liriez sur le graphique de l'unité de temps supérieure elle-même, sans l'ouvrir.
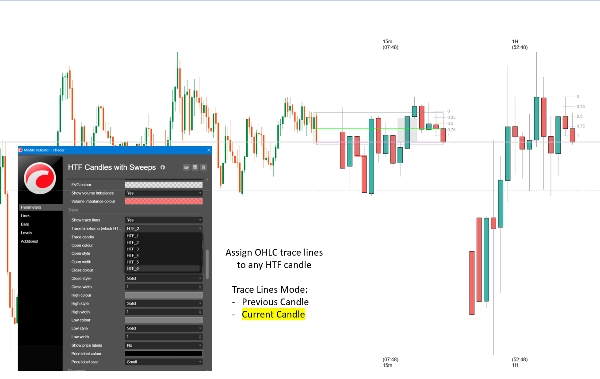
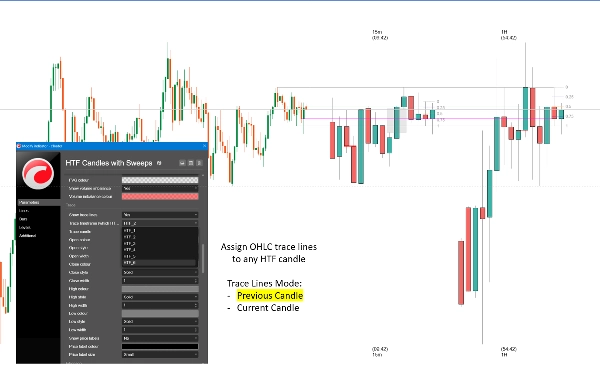
Les lignes de trace relient l'ouverture, le plus haut, le plus bas et la clôture d'une unité de temps choisie à la barre exacte sur votre graphique où chacun s'est imprimé, afin que vous puissiez voir d'où vient un niveau. Choisissez la chandelle encore en formation ou la dernière terminée.
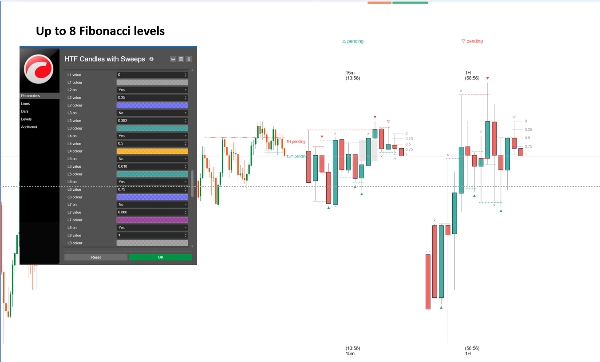
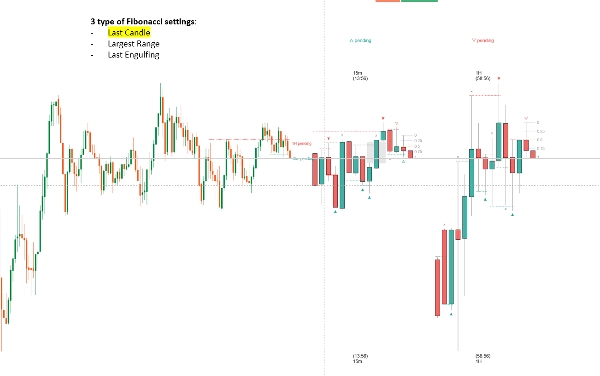
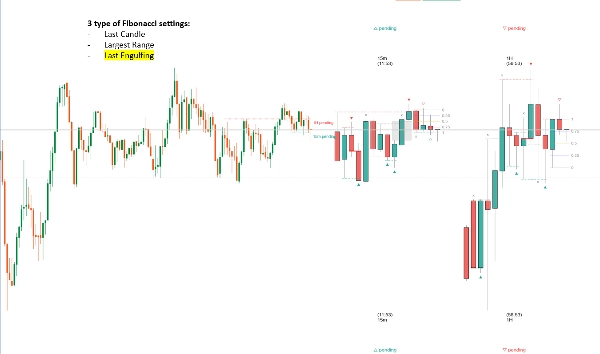
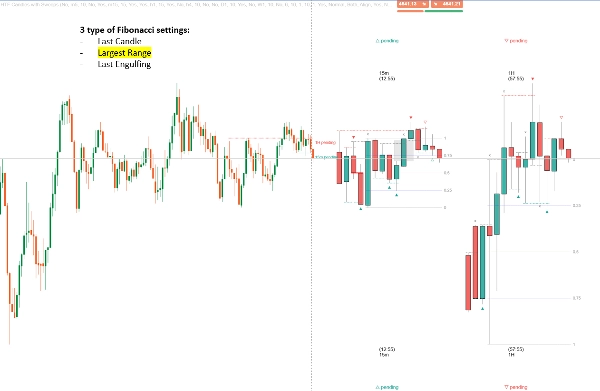
Les niveaux de Fibonacci se projettent à partir d'une chandelle d'une unité de temps supérieure avec huit niveaux configurables et une Ancre Intelligente qui choisit la chandelle pour vous : la dernière barre terminée, la chandelle la plus large du plus haut au plus bas visible, ou la chandelle d'englobement la plus récente.
Détection des balayages de liquidité
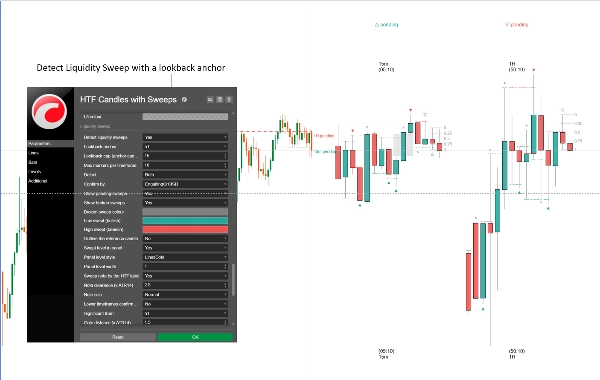
Pour chaque chandelle terminée d'une unité de temps supérieure, le moteur remonte en arrière et trouve le plus haut le plus élevé — ou le plus bas le plus bas — que la chandelle a réellement franchi, s'arrêtant à la première chandelle qu'elle n'a pas pu franchir. Ce niveau est ce que le balayage a pris.
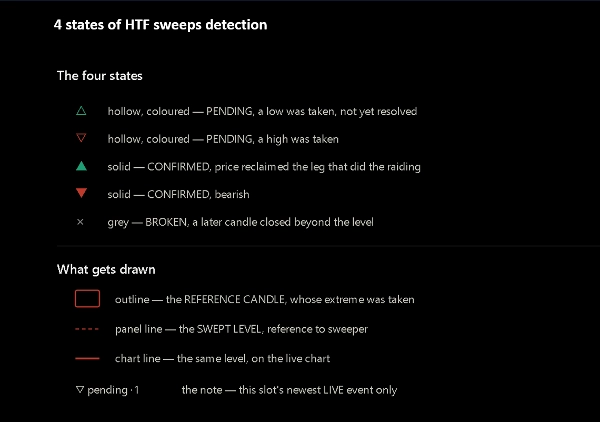
Le balayage est ensuite suivi à travers quatre états :
— En attente — le niveau a été pris, rien ne l'a encore résolu
— Confirmé par CISD — le prix est revenu en clôturant à travers l'ouverture de la course qui a produit l'extrême
— Confirmé par englobement — le corps d'une chandelle ultérieure a englouti la chandelle de balayage et a clôturé contre elle
— Cassé — une chandelle ultérieure a clôturé au-delà du niveau, donc c'était une cassure, pas un balayage
Chaque état porte son propre marqueur, donc une chandelle qui a balayé quelque chose le montre toujours, et le marqueur vous indique comment cela s'est terminé. Rien ne se repeint : seules les chandelles terminées sont jugées, et chaque changement d'état est décidé à la clôture.
Confluence inter-unités de temps
Une fenêtre de retour est exprimée en chandelles d'une unité de temps ancre et convertie en nombre de chandelles propre à chaque emplacement, ainsi un balayage 15m et un balayage horaire sont mesurés sur la même période de marché. Lorsque plusieurs unités de temps sont d'accord, elles décrivent réellement le même événement.
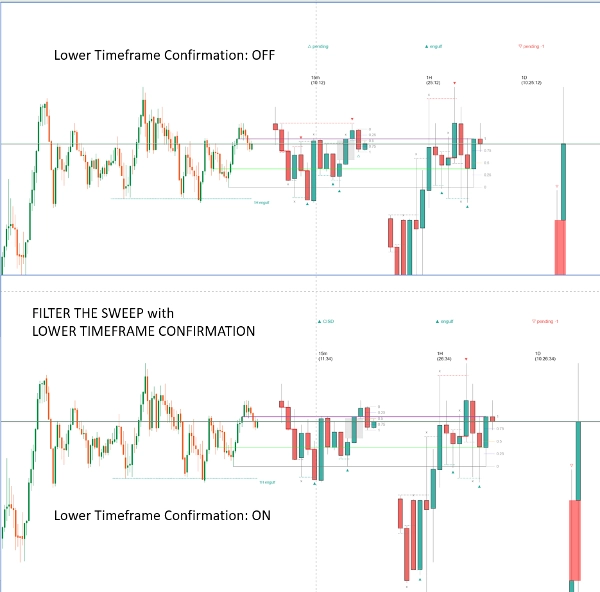
Une porte optionnelle va plus loin : les unités de temps en dessous d'une division que vous choisissez ne rapporteront un balayage que lorsqu'une unité de temps au-dessus d'elles en a déjà un en direct, dans la même direction, à un prix comparable. Les unités de temps inférieures cessent de rapporter le bruit de la plage et commencent à confirmer le mouvement plus important.
Niveaux balayés sur votre graphique
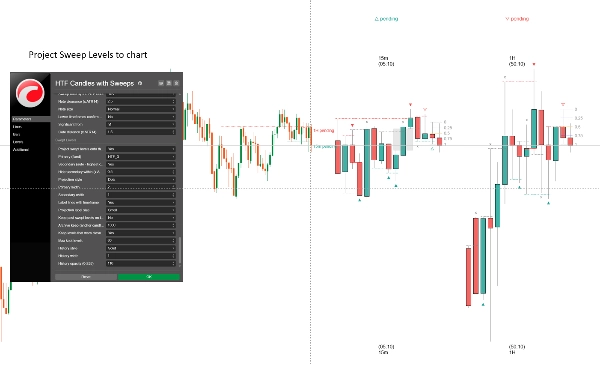
Le panneau montre les chandelles ; le graphique montre le prix. Un niveau balayé se dessine comme une ligne horizontale partant de l'endroit où la chandelle de référence s'est réellement formée, vers l'avant jusqu'à maintenant — étiquetée avec son unité de temps et son état actuel. Une ligne primaire provient d'une unité de temps que vous fixez ; une ligne secondaire se remplit automatiquement avec la plus haute autre unité de temps actuellement balayée.
Une archive optionnelle conserve les niveaux balayés passés sur le graphique après que leur chandelle a défilé hors du panneau, afin que vous puissiez revoir comment la détection s'est comportée au cours de la session.
Utilisation typique
Tradez à partir d'un graphique 5m ou 15m pendant que les chandelles horaires et 4 heures sont à côté. Lorsqu'une unité de temps supérieure balaye un niveau et confirme, vous avez une direction et un prix sur lesquels travailler. Lorsque l'unité de temps inférieure est d'accord, vous avez une confluence. Lorsqu'un niveau casse à la place, le marqueur vous l'indique aussi, et vous arrêtez d'attendre un retournement qui ne vient pas.
Cela convient au trading de type balayage de liquidité et smart money, au travail sur les cassures ratées, et à toute approche construite autour des plus hauts et plus bas précédents. Utile sur le forex, les indices, les métaux et la crypto.
Paramètres
— Six emplacements d'unité de temps, chacun avec résolution, nombre de chandelles, bascule fibonacci et style complet
— Disposition du panneau : marge depuis le prix, largeur des chandelles, espacement entre les chandelles et entre les unités de temps
— Étiquettes : nom de l'unité de temps en haut et en bas, minuterie de compte à rebours, valeurs d'intervalle, tailles et couleurs
— Déséquilibre : gaps de juste valeur et déséquilibres de volume, couleurs ajustables
— Lignes de trace : quel emplacement, chandelle actuelle ou précédente, couleur par ligne, style, largeur et étiquettes de prix
— Fibonacci : huit niveaux avec valeurs individuelles, couleurs et bascules, plus trois modes d'Ancre Intelligente
— Détection de balayage : ancre et plafond de retour, direction, voie de confirmation, limite de marqueurs par unité de temps
— Apparence des marqueurs pour états en attente, confirmés et cassés
— Porte de confluence : division d'unité de temps et tolérance de distance
— Projection sur graphique : emplacement primaire, secondaire automatique, styles et étiquettes
— Archive : conservation dans les chandelles ancre, maximum conservé, style
Pour qui c'est
Les traders intraday et swing qui travaillent déjà à partir des plus hauts et plus bas d'unités de temps supérieures et veulent les voir sans changer de graphique. Il suppose que vous savez ce qu'est un balayage de liquidité et pourquoi une récupération est importante. Si les balayages ne font pas déjà partie de votre lecture d'un graphique, ceci ne vous apprendra pas à les trader.
Ce que cela ne fait pas
Être clair à ce sujet maintenant nous fait gagner du temps à tous les deux plus tard :
— Il ne donne aucun signal d'achat ou de vente, ni aucun prix d'entrée, stop ou cible
— Il ne passe aucun ordre et ne peut pas toucher à votre compte — l'indicateur fonctionne sans aucun droit d'accès
— Il n'a pas d'alertes ni de notifications
— Il ne prédit rien. Chaque marqueur décrit des chandelles déjà clôturées
— Il ne se repeint pas. Seules les chandelles terminées sont jugées, donc un marqueur ne change jamais après coup
— Ce n'est pas une stratégie. Un balayage confirmé décrit ce que le prix a fait, pas ce que vous devriez en faire
Choses à savoir
La détection lit les chandelles que chaque emplacement dessine réellement, donc un balayage a toujours une chandelle à l'écran pour le marquer.
Augmenter le nombre de chandelles d'un emplacement élargit la portée de son regard en arrière.
Les chandelles des unités de temps supérieures commencent à l'heure du serveur de votre courtier. Deux courtiers sur le même instrument peuvent couper l'heure ou le jour à des points différents, ce qui signifie que le même symbole peut légitimement se lire différemment sur deux plateformes. C'est une propriété des données, pas un défaut de l'indicateur.
Un balayage sur la chandelle la plus récemment clôturée ne peut être qu'en attente — la confirmation nécessite qu'une chandelle ultérieure clôture. Sur l'emplacement journalier, cela signifie attendre un jour.
Le trading comporte des risques. Les performances passées ne garantissent pas les résultats futurs.
Résumé
The indicator detects liquidity sweeps—candles that trade through previous highs or lows to capture resting orders—and tracks their resolution through four states: pending, confirmed by close inside the sweep’s range, confirmed by engulfing candle, or broken (breakout). These states are visually marked and only finalized on completed candles, ensuring no repainting.
Additional features include marking fair value gaps and volume imbalances between candles, trace lines linking higher timeframe candle levels to your chart, and configurable Fibonacci levels projected from selected higher timeframe candles with smart anchoring options.
Cross-timeframe confluence is supported by aligning sweep detection across multiple timeframes, with an optional gate to filter lower timeframe sweeps that confirm higher timeframe moves. Swept levels are drawn as horizontal lines on your chart with labels indicating timeframe and state, with an optional archive to retain past levels.
Designed for intraday and swing traders familiar with liquidity sweeps and higher timeframe analysis, it supports markets including forex, indices, metals, and crypto. The indicator does not provide trade signals, alerts, or order execution and operates solely as a visual analysis tool based on completed price data.
Discussion
Avis clients
Questions fréquentes
Plus de cet auteur




















Prix