설명
양자 가중 이동 평균(QWMA)
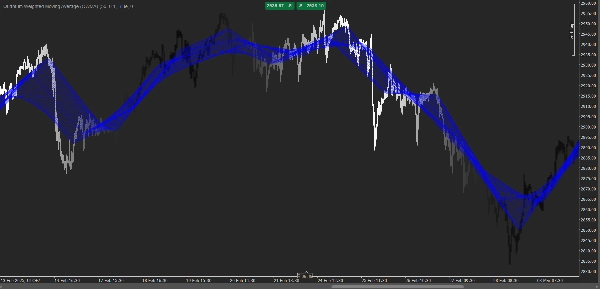
The 양자 가중 이동 평균(QWMA)는 시장 상황에 따라 과거 가격의 가중치를 동적으로 조정하도록 설계된 고급 거래 지표입니다. 고정 가중치를 적용하는 전통적인 이동 평균과 달리, QWMA는 적응형 지수 감쇠 함수를 사용하여 최근 가격 변동에 더 큰 중요성을 부여하면서도 과거 데이터를 고려합니다.
주요 특징:
✅ 적응형 가중치: 변동성과 추세 강도에 따라 과거 가격의 영향을 조정합니다.
✅ 향상된 민감도: 단순 및 지수 이동 평균보다 가격 변화에 더 빠르게 반응합니다.
✅ 노이즈 감소: 추세의 명확성을 유지하면서 시장 노이즈를 걸러내는 데 도움을 줍니다.
✅ 사용자 정의 가능한 매개변수: 거래 전략에 맞게 감쇠 계수와 가중치 함수를 수정할 수 있습니다.
작동 원리:
QWMA는 과거 가격 데이터에 지수 감쇠 함수를 적용하여 오래된 가격의 영향력을 점차 줄이고 최근 값이 더 크게 기여하도록 합니다. 이로 인해 시장 역학 변화에 적응하는 더 부드럽고 반응성이 높은 추세선이 생성됩니다.
적합 대상:
📈 추세 추종자 – 최소한의 지연으로 강한 추세를 식별합니다.
📉 스윙 트레이더 – 표준 이동 평균보다 더 빨리 시장 반전을 감지합니다.
💹 스캘퍼 – 단기 모멘텀 변화를 빠르게 파악할 수 있습니다.
QWMA는 부드러움과 반응성 사이의 균형을 추구하는 트레이더에게 강력한 도구이며, 주식, 외환, 암호화폐 거래를 포함한 다양한 금융 시장에 적합합니다. 🚀
요약
고객 리뷰
5 | 0 % | |
4 | 100 % | |
3 | 0 % | |
2 | 0 % | |
1 | 0 % |