Logotipo de "CursorByte.SupportResistance v3"
CursorByte.SupportResistance v3
5.0
Valoraciones: 1
Imagen cargada de "CursorByte.SupportResistance v3"
Desde 31/10/2024
44
Ventas
1.65K
Instalaciones gratis

***Improved version***

https://ctrader.com/products/2113
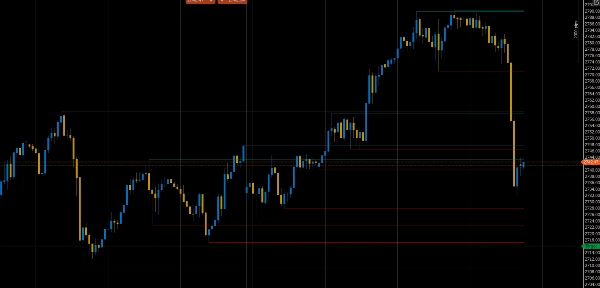
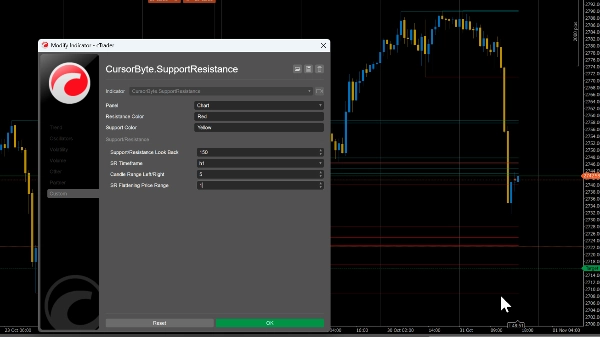

***********************


You can set the flattening price range based on the pair. Either 0.0001 for pairs like GU and 1.5 for Gold.

This indicator automatically identifies key support and resistance levels on the chart, helping traders spot potential reversal zones, breakout points, and areas of price consolidation for better entry and exit decisions.


NB: Use the flattening price range to reduce clutter on the chart (consolidate SR lines within a particular price range into one).


Indicator profile
5.0
Valoraciones: 1
5
100 %
4
0 %
3
0 %
2
0 %
1
0 %
Valoraciones de clientes
August 12, 2025
Pros: Accurate auto SR levels, customizable design, stable performance. Cons: No significance filter, no auto-clear, possible chart clutter.
Breakout
Commodities
XAUUSD
Products available through cTrader Store, including trading bots, indicators and plugins, are provided by third-party developers and made available for informational and technical access purposes only. cTrader Store is not a broker and does not provide investment advice, personal recommendations or any guarantee of future performance.

Más de este autor

Auto-detect support and resistance & trendlines, highlight pullbacks/BOS retests, and filter with candle confirmation.
Visual calendar with daily PnL, trades, win rate, profit factor, and performance insights.
Visualize trading volume by price within any range, highlight POC and key value areas.
Auto-detect support and resistance & trendlines, highlight pullbacks/BOS retests, and filter with candle confirmation.
Trade with clarity. Protect your capital. Let Risk Manager enforce the rules.
0%
Disminución máxima
Apply Stop Loss and Take Profit to all positions and pending orders in one click.
A professional trading utility that displays real-time daily range statistics directly on your chart
Automatically plots Daily and Weekly Fibonacci retracements with smart redraw and session control.

Puede interesarle

🔮 Smart Bar Predictor - Professional Volatility Forecasting Indicator
SUPER TREND OSCILLATOR TRIAL DAY15
🚀 QQEX Trinity Indicator - The Ultimate Trading Filter 🚀
Overbought Oversold Indicator
The RSI NextGen is an advanced and modernized version of the classic Relative Strength Index (RSI)
Fractals is a precision-engineered trading indicator for cTrader that reveals the hidden architecture of price action.
Market Profile TPO – Advanced Auction Market Analysis for cTrader
Option pricing using the BlackScholes model and the Math.Numerics packages
The KDJ oscillator display consists of 3 lines (K, D and J - hence the name of the display) and 2 levels.
Logotipo de "Round Numbers"
4.0
(3)
Gratis
Automatically draws major, minor, and trace support/resistance levels at round numbers
📊Identify and validate rounding price structures—commonly known as "Cups" and "Inverted Cups"—using...
Heikin Ashi (Heiken Ashi) - This indicator displays Heikin Ashi candles.
you could put your check list in your chart you could split your test with “,” you could put your checklist in indicat
ZigZag Pro – Multi-Swing Indicator for cTrader Description: ZigZag Pro is a powerful and fully customizable swing indica
Label each candle sequentially with flexible session resets.
Morning Star pattern on chart (Bullish and Bearish) automatically marked with (BUY & SELL) Very powerful signals.
EMA MTF TREND PRO - Multi-timeframe trend analysis overlay indicator, 6 timeframes - in one table with ADX
Average Directional Index (ADX), Directional Clouds (DI Cloud), On-Chart Info Panel, Built-in Volatility Filter (ATR)
Desde 31/10/2024
44
Ventas
1.65K
Instalaciones gratis