
Mô tả
Chỉ báo Pinescriptlabs Store: 🤖Pinescriptlabs Store cBots : (cBot) Gold & BTC BreakoutSession Pivots(mới)
SmartTrend Support &
Resistance
Lines
Phân tích
Cấu trúc Thị trường
Động
của
Các điểm
Quay đầu
Fibonacci
Hồi quy
Tuyến tính
Đa khung thời gian
Theo dõi
Thiên hướng Nến
Đa cấp
Tự động
Hỗ trợ và
Kháng cự
Xu hướng
Đường
Tất cả
Hỗ trợ và
Kháng cự
Cấp độ
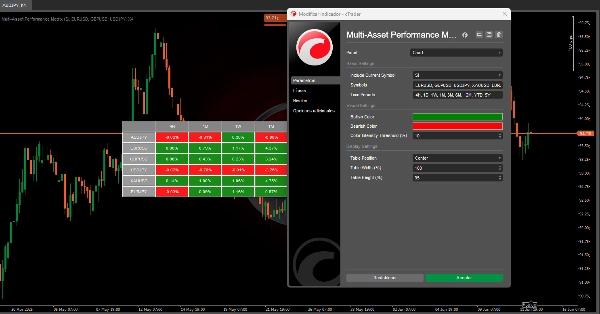
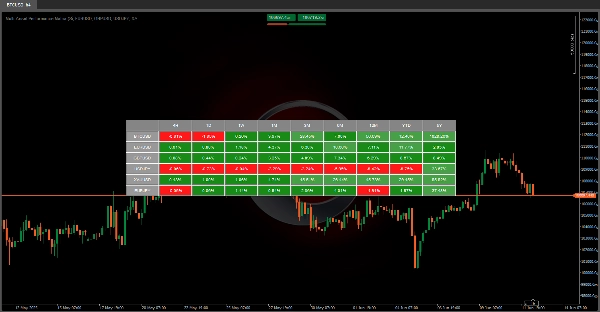
🚀 MA TRẬN HIỆU SUẤT ĐA TÀI SẢN 🚀
Thuật toán này là một công cụ trực quan mạnh mẽ 📊 được thiết kế để hiển thị hiệu suất phần trăm của nhiều công cụ tài chính qua các khoảng thời gian khác nhau.
Nó biến đổi dữ liệu lịch sử thành một trực quan hiệu quả và trực quan, cho phép người dùng nhanh chóng đánh giá hành vi của các tài sản tài chính khác nhau.
❓ Công cụ này làm gì?
1️⃣ 📈 So sánh Tài sản: Hiển thị cách giá của các công cụ tài chính khác nhau (như BTCUSD, EURUSD, XAUUSD, v.v.) đã thay đổi theo thời gian.
- Khung thời gian: D (Hàng ngày) | 1W (Hàng tuần) | 1M (Hàng tháng) | 3M (Hàng quý) | 6M (Nửa năm) | 12M (Hàng năm) | YTD (Từ đầu năm đến nay) | 5Y (5 năm gần nhất)
2️⃣ 🎨 Làm nổi bật Xu hướng: Sử dụng mã màu (🟢, 🔴 ) để ngay lập tức nhận biết tài sản nào đang tăng hoặc giảm trong mỗi khoảng thời gian.
3️⃣ ⏱️ Tự động Cập nhật: Làm mới dữ liệu mỗi phút để phản ánh thông tin thị trường mới nhất.
💡 Tại sao điều này hữu ích?
✔ 📊 Phân tích So sánh: Cho phép so sánh song song nhiều tài sản—lý tưởng cho quản lý danh mục đầu tư hoặc chọn các tài sản có hiệu suất hàng đầu dựa trên khoảng thời gian.
✔ 🛡️ Kiểm soát: Đánh giá sự ổn định (hoặc biến động) của một tài sản qua các khoảng thời gian khác nhau giúp đánh giá rủi ro liên quan.
✨ Chính
✅ ⏳ Tiết kiệm Thời gian: Việc thu thập và tính toán dữ liệu này thủ công sẽ mất hàng giờ—công cụ này làm điều đó ngay lập tức!
✅ 👀 Rõ ràng về mặt trực quan: Hệ thống mã màu khiến việc phân tích trở nên dễ dàng, ngay cả với người dùng không chuyên về kỹ thuật.
✅ 🔄 Linh hoạt: Hỗ trợ ký hiệu tùy chỉnh, vì vậy bạn có thể theo dõi các tài sản quan trọng đối với bạn.
Tóm tắt
Đánh giá của khách hàng
5 | 100 % | |
4 | 0 % | |
3 | 0 % | |
2 | 0 % | |
1 | 0 % |


