
Compare Symbol
Indicateur
199 téléchargements
Version 1.0, May 2025
Windows, Mac
Description
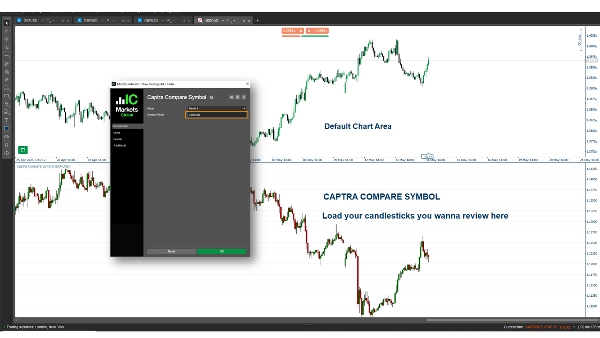
Captra Compare Symbol est un indicateur cTrader qui affiche le prix de clôture et dessine des chandeliers (mèche, corps) pour un symbole sélectionné, comme EURUSD, sur le graphique. Il prend en charge plusieurs périodes (par exemple, 5M, 15M, 1H, Daily) avec des visuels personnalisables, utilisant les prix d'ouverture/fermeture/haut/bas pour une représentation précise.
Résumé
Résumé IA
Captra Compare Symbol is a cTrader indicator that visualizes price data of a selected trading symbol, such as EURUSD, directly on the chart. It plots the close price and renders candlesticks—including wicks and bodies—using open, high, low, and close prices for precise representation. The indicator supports multiple timeframes, including 5-minute, 15-minute, 1-hour, and daily intervals. Visual elements are customizable to fit user preferences. This tool enables traders to compare the price action of an additional symbol alongside their primary chart, facilitating multi-symbol analysis within the cTrader platform.
Profil de l'indicateur
Avis clients
0.0
Avis : 0
Avis clients
Il n'y a pas encore d'avis sur ce produit. Vous l'avez déjà essayé ? Soyez le premier à en parler aux autres !
Discussion
Questions fréquentes
EURUSD
Les produits disponibles sur cTrader Store, notamment les bots de trading, les indicateurs et les plug-ins, sont fournis par des développeurs tiers et mis à disposition à titre informatif et à des fins d'accès technique uniquement. cTrader Store n'est pas un courtier et ne fournit aucun conseil en investissement, aucune recommandation personnelle ni aucune garantie quant aux performances futures.
Plus de cet auteur


Prix
86.67M
Volume tradé
1.99M
Pips gagnés
3.66K
Installations gratuites