
Head Shoulders Finder
Indicateur
448 téléchargements
Version 1.0, May 2025
Windows, Mac
5.0
Avis : 1
Description
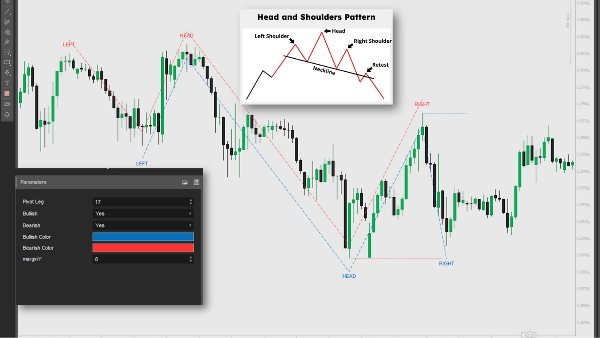
Cet indicateur identifie les figures Tête et Épaules ainsi que Tête et Épaules Inversées en analysant les sommets et creux pivots dans les données de prix. Il trace des lignes, des étiquettes et des signaux pour les retournements de tendance potentiels, déclenchant des positions courtes lorsque le prix passe en dessous de la ligne de cou (baissier) ou des positions longues lorsqu'il est au-dessus (haussier). Les traders peuvent utiliser ces signaux pour entrer en position courte ou longue, en les combinant avec d'autres analyses et une gestion des risques afin d'optimiser les stratégies de trading.
Résumé
Résumé IA
The Head Shoulders Finder is a technical indicator designed to detect Head and Shoulders and Inverted Head and Shoulders chart patterns by analyzing pivot highs and lows in price data. It visually marks these patterns with lines and labels on the price chart, highlighting potential trend reversal points. The indicator generates trading signals by identifying when the price crosses the neckline: a break below signals a bearish trend reversal suitable for short positions, while a break above indicates a bullish reversal for long positions. Traders can use these signals alongside other technical analyses and risk management strategies to inform entry decisions. This tool supports pattern recognition and signal plotting to assist in identifying potential trading opportunities based on classic reversal formations.
Profil de l'indicateur
Avis clients
5.0
Avis : 1
5 | 100 % | |
4 | 0 % | |
3 | 0 % | |
2 | 0 % | |
1 | 0 % |
Avis clients
August 18, 2025
Automatically detects Head & Shoulders patterns, customizable visuals. Cons: No pattern reliability filter, no alerts, false signals on low TFs.
Discussion
Questions fréquentes
Les produits disponibles sur cTrader Store, notamment les bots de trading, les indicateurs et les plug-ins, sont fournis par des développeurs tiers et mis à disposition à titre informatif et à des fins d'accès technique uniquement. cTrader Store n'est pas un courtier et ne fournit aucun conseil en investissement, aucune recommandation personnelle ni aucune garantie quant aux performances futures.
Plus de cet auteur


Prix
86.67M
Volume tradé
1.99M
Pips gagnés
3.67K
Installations gratuites