Description
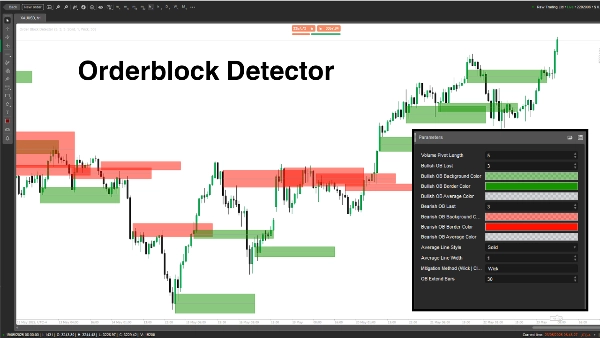
L'indicateur "Order Block Detector" est conçu pour repérer et afficher les blocs d'ordre (OB) sur le graphique des prix — des zones clés où les gros acteurs (institutions) placent des ordres d'achat ou de vente importants, déclenchant souvent de fortes réactions de prix. Il aide les traders à identifier des zones de support/résistance potentielles pour des entrées de trade plus intelligentes, des stop-loss ou des take-profits.
Concept
- Blocs d'ordre : Ce sont des zones de prix où le marché inverse ou fait une pause en raison d'un flux important d'ordres institutionnels. L'indicateur détecte les OB en analysant les pics de volume pivot et l'état du marché (haussier/baissier).
- Fonctionnement :
-
- Détermine l'état du marché (haussier/baissier) en comparant les plus hauts/bas à une période de référence (Length).
- Identifie les OB aux pics de volume liés à des niveaux de prix clés.
- Trace des rectangles et des lignes moyennes pour marquer les OB, tout en vérifiant et supprimant les OB atténués lorsque le prix les franchit.
- Cas d'utilisation : Les traders peuvent utiliser les OB comme des zones à haute probabilité pour les configurations de trade, la gestion des risques ou les objectifs de profit.
Détail des paramètres
- Longueur du pivot de volume (Length, par défaut : 5, min : 1)
-
- Ce que ça fait : Définit la période de référence (nombre de barres) pour calculer les plus hauts/bas et les pics de volume pivot.
- Pourquoi c'est important : Une longueur plus longue augmente la précision mais réduit la fréquence des OB ; une longueur plus courte détecte plus d'OB mais peut inclure du bruit.
- Dernier OB haussier (BullExtLast, par défaut : 3, min : 1)
-
- Ce que ça fait : Limite le nombre d'OB haussiers stockés et suivis.
- Pourquoi c'est important : Limite le nombre d'OB haussiers affichés pour garder le graphique clair et optimiser la performance.
- Couleur de fond des OB haussiers (BgBullCss, par défaut : #80169400)
-
- Ce que ça fait : Définit la couleur de fond et la transparence des rectangles OB haussiers.
- Pourquoi c'est important : Aide à distinguer visuellement les OB haussiers sur le graphique.
- Couleur de bordure des OB haussiers (BullCss, par défaut : #169400)
-
- Ce que ça fait : Définit la couleur de la bordure des rectangles OB haussiers.
- Pourquoi c'est important : Améliore la visibilité des zones OB haussières.
- Couleur moyenne des OB haussiers (BullAvgCss, par défaut : #609598A1)
-
- Ce que ça fait : Colore la ligne moyenne à l'intérieur des OB haussiers.
- Pourquoi c'est important : Marque le point médian de l'OB, servant de niveau de référence clé pour les traders.
- Dernier OB baissier (BearExtLast, par défaut : 3, min : 1)
-
- Ce que ça fait : Limite le nombre d'OB baissiers stockés et suivis.
- Pourquoi c'est important : Comme BullExtLast, garde le graphique dégagé en limitant les OB baissiers.
- Couleur de fond des OB baissiers (BgBearCss, par défaut : #80FF1100)
-
- Ce que ça fait : Définit la couleur de fond et la transparence des rectangles OB baissiers.
- Pourquoi c'est important : Différencie les OB baissiers des OB haussiers.
- Couleur de bordure des OB baissiers (BearCss, par défaut : #FF1100)
-
- Ce que ça fait : Définit la couleur de la bordure des rectangles OB baissiers.
- Pourquoi c'est important : Rend les OB baissiers visibles pour une identification rapide.
- Couleur moyenne des OB baissiers (BearAvgCss, par défaut : #609598A1)
-
- Ce que ça fait : Colore la ligne moyenne à l'intérieur des OB baissiers.
- Pourquoi c'est important : Met en évidence le niveau de prix central des OB baissiers pour la planification des trades.
- Style de la ligne moyenne (LineStyle, par défaut : Solide)
-
- Ce que ça fait : Définit le style de la ligne moyenne des OB (Solide, Pointillé, En pointillés).
- Pourquoi c'est important : Personnalise l'apparence de la ligne moyenne selon les préférences du trader.
- Largeur de la ligne moyenne (LineWidth, par défaut : 1, min : 1)
-
- Ce que ça fait : Ajuste l'épaisseur de la ligne moyenne des OB.
- Pourquoi c'est important : Contrôle la visibilité de la ligne moyenne sur le graphique.
- Méthode d'atténuation (Mitigation, par défaut : "Wick")
-
- Ce que ça fait : Définit comment les OB sont invalidés :
-
- Wick : Utilise le prix le plus bas (OB haussier) ou le prix le plus haut (OB baissier) pour vérifier l'atténuation.
- Close : Utilise le prix de clôture pour vérifier l'atténuation.
- Pourquoi c'est important : Influence la sensibilité de l'indicateur au franchissement des zones OB, impactant le moment où les OB sont supprimés.
L'Order Block Detector est un outil puissant pour repérer les zones d'ordres institutionnels basées sur les pics de volume et l'action des prix. Il trace clairement des rectangles OB avec des lignes moyennes et supprime dynamiquement ceux invalidés. Les traders peuvent ajuster les paramètres pour affiner la détection, l'affichage et la gestion des OB afin de correspondre à leur style de trading.
Résumé
The indicator works by analyzing volume pivot highs and determining market state (bullish or bearish) based on highs and lows over a configurable lookback period. It marks OBs with rectangles and average lines, dynamically removing those invalidated when price breaks through the zones. Users can customize parameters such as the lookback length, the number of bullish and bearish OBs tracked, colors and styles of OB rectangles and average lines, and the method used to detect OB mitigation (using wick or close prices).
This flexibility allows traders to tailor the detection and visualization of Order Blocks to their trading style, aiding in identifying high-probability zones for trade setups, risk management, and profit targeting.
Avis clients
5 | 100 % | |
4 | 0 % | |
3 | 0 % | |
2 | 0 % | |
1 | 0 % |