
説明
Time To Break Even Indicator v2
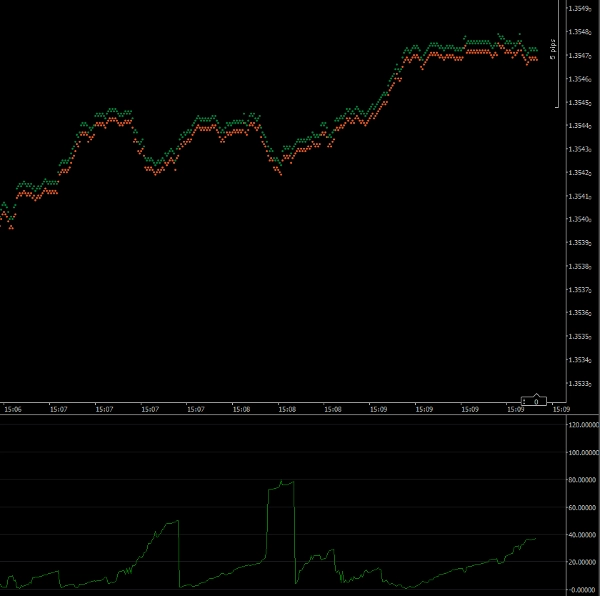
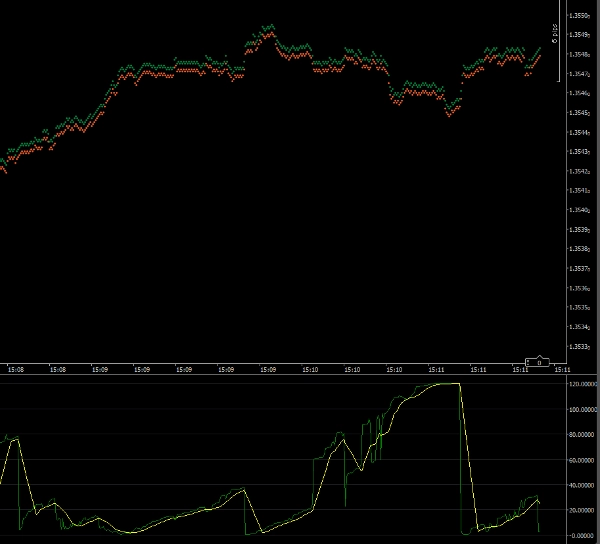
このインジケーターは、取引の市場へのエントリーのタイミングを支援します。プロットは、取引が損益分岐点に達するまでの予想秒数を示します。市場が速くかつあなたの方向に動いている場合、インジケーターは小さな数値を示します。市場があなたに逆行しているか、ゆっくり動いている場合は、数値が大きくなります。
インジケーターは、取引が損益分岐点に達するために必要なピップ数を計算します。その後、現在の価格の動く速度と比較します。
注:このインジケーターは1ティックのタイムフレームで実行する必要があります。
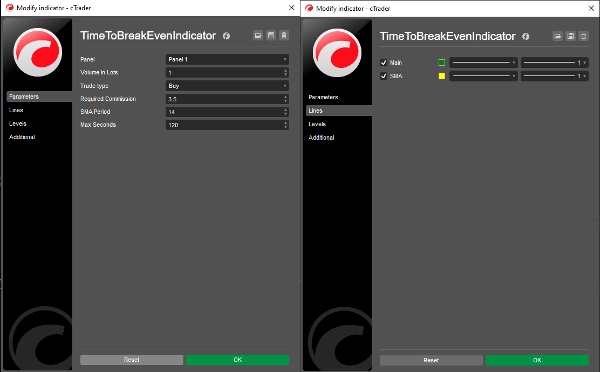
パラメーター
ロット数:提案された取引のボリューム
取引タイプ:買いか売りか
必要な手数料:取引にかかる手数料(クイックトレードウィンドウから取得可能)
SMA期間:単純移動平均の期間(デフォルト=14)
最大秒数:記録される最大秒数(以下参照)
ライン
メイン:インジケーターのプロットライン(デフォルト=緑)
SMA:単純移動平均のプロットライン(デフォルト=黄色)
最大秒数
インジケーターが非常に大きな値を表示できるようにすると、損益分岐点までの時間が短い場合に詳細が見えにくくなります。このパラメーターを設定することで、インジケーターの最大スケールを設定できます。デフォルトでは120秒(2分)に設定されています。したがって、2分以上の出力は120秒としてプロットされます。
Dr Andy Larkin
Copyright 2025, All Rights Reserved
2025年5月26日
法的事項
このインジケーターの結果は、ライブ取引で使用する前に正確性を確認してください。
このインジケーターの結果について、保証は明示的にも黙示的にも行われません。
このインジケーターの使用により生じた損失について、一切の責任を負いません。
概要
カスタマーレビュー
5 | 50 % | |
4 | 50 % | |
3 | 0 % | |
2 | 0 % | |
1 | 0 % |


