
Description
Indicateur Time To Break Even LITE
Version Lite
Ceci est la version d'essai gratuite de l'indicateur Time To Break Even. Elle est limitée à EURGBP et ne fonctionnera que pendant 2 minutes.
Indicateur Time To Break Even
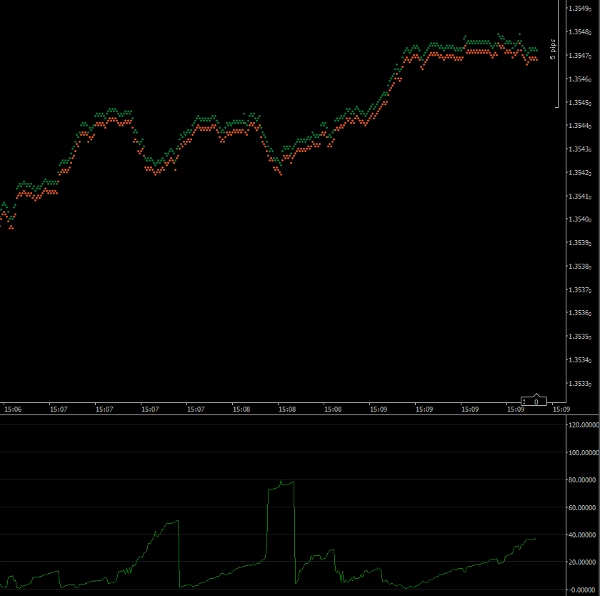
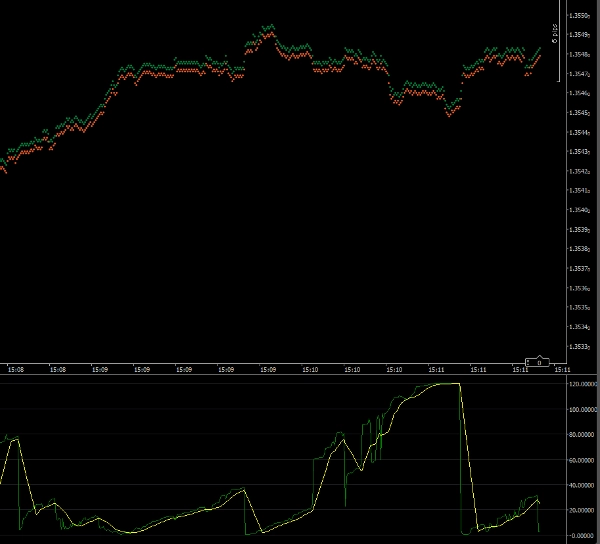
Cet indicateur vous aidera à synchroniser l'entrée de votre trade sur le marché. Le graphique vous montre le nombre probable de secondes pour que votre trade atteigne le seuil de rentabilité. Si le marché évolue rapidement et dans votre direction, l'indicateur affichera un petit nombre. Si le marché évolue contre vous ou lentement, le nombre sera plus grand.
L'indicateur calcule le nombre de pips nécessaires à votre trade pour atteindre le seuil de rentabilité. Il compare ensuite cela avec la vitesse actuelle à laquelle le prix évolue.
N.B. Cet indicateur doit être utilisé sur la période de temps 1 Tick.
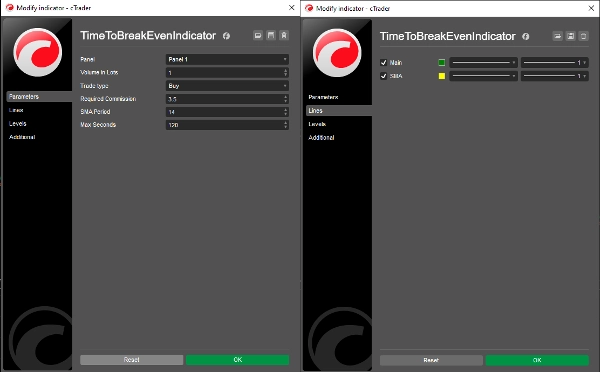
Paramètres
Volume en Lots : Le volume de votre trade proposé
Type de Trade : Si votre trade est un achat ou une vente
Commission Requise : La commission que votre trade engendrera (vous pouvez l'obtenir depuis la fenêtre Quick Trade)
Période SMA : La période de la moyenne mobile simple (par défaut = 14)
Secondes Max : Le nombre maximum de secondes qui sera enregistré (voir ci-dessous)
Lignes
Principale : La ligne de tracé de l'indicateur (par défaut = vert)
SMA : La ligne de tracé de la moyenne mobile simple (par défaut = jaune)
Secondes Max
Permettre à l'indicateur d'afficher des valeurs très élevées signifie que l'échelle de l'indicateur vous empêchera de voir les détails lorsque le temps pour atteindre le seuil de rentabilité est court. Ce paramètre vous permet de définir l'échelle maximale de l'indicateur. Par défaut, il est réglé sur 120 (2 minutes). Ainsi, toute valeur de 2 minutes ou plus sera affichée comme 120 secondes.
Dr Andy Larkin
Copyright 2025, Tous droits réservés
26 mai 2025
Mentions légales
Les résultats de cet indicateur doivent être vérifiés pour leur exactitude avant utilisation en trading en direct.
Aucune garantie n'est donnée ni implicite concernant les résultats de cet indicateur.
Aucune responsabilité n'est acceptée pour toute perte résultant de l'utilisation de cet indicateur.


![Logo de "[CB] Pivot Points Pro"](https://cdn.ctrader.com/image/webp/43463c82-67b0-4f10-a4ba-901bba091d81_32594)


