
Candle Timer & Strength Demo
Indicateur
266 téléchargements
Version 1.0, Jul 2025
Windows, Mac
Description
Caractéristiques principales :
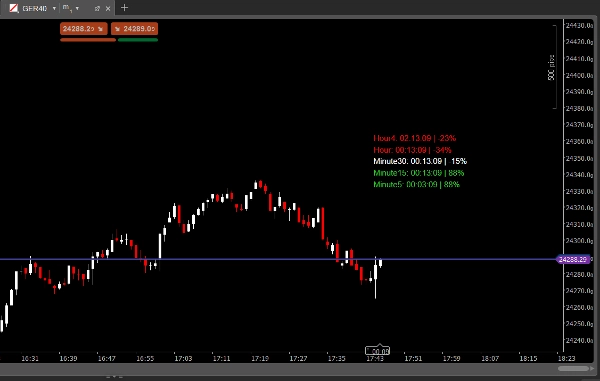
- Minuteurs de bougies multi-échelles temporelles :
Voir le compte à rebours jusqu'à la fermeture de la prochaine bougie sur jusqu'à 5 échelles temporelles sélectionnées, le tout dans un panneau clair. - Force de la bougie en % :
Voir instantanément la force de la bougie actuelle (de -100 % à +100 %) pour chaque échelle temporelle, en fonction de la position de la clôture par rapport à la plage de la bougie. - Panneau personnalisable :
-
- Définissez la taille de la police, la distance par rapport à la dernière bougie et l'espacement vertical.
- Choisissez vos échelles temporelles préférées (M1, M5, M15, M30, H1, H4, etc.).
- Les couleurs changent automatiquement : vert pour un fort haussier, rouge pour un fort baissier, blanc pour neutre.
- Toujours visible :
Le panneau est toujours visible sur votre graphique, ce qui facilite la surveillance du timing et du momentum du marché en un coup d'œil. - Parfait pour :
-
- Les scalpers et daytraders qui ont besoin d'un timing précis des bougies.
- Les traders multi-échelles temporelles qui veulent voir le momentum et le timing en un seul endroit.
- Toute personne souhaitant améliorer son timing d'entrée/sortie et ses compétences en lecture de bougies.
Comment ça fonctionne :
- L'indicateur calcule le temps restant jusqu'à la fermeture de la bougie actuelle pour chaque échelle temporelle sélectionnée.
- Il calcule également la force de la bougie en pourcentage :
-
- +100% = clôture tout en haut de la bougie (fort haussier)
- -100% = clôture tout en bas (fort baissier)
- 0% = clôture au milieu (neutre)
- Le panneau se met à jour en temps réel et est entièrement personnalisable.
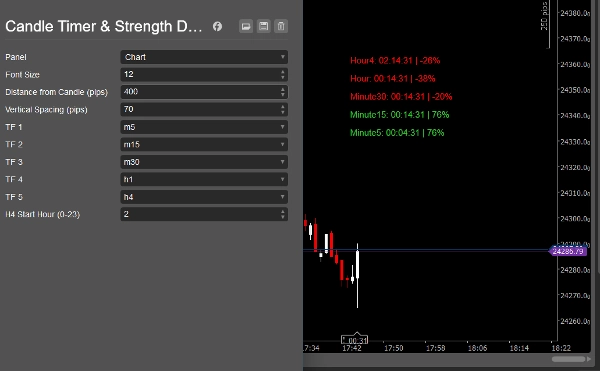
Paramètres :
- Taille de la police
- Distance de la bougie (pips)
- Espacement vertical (pips)
- Échelle temporelle 1–5 (personnalisée)
- Heure de début H4 (pour les brokers avec des bougies H4 non standard)
Pourquoi choisir Candle Timer & Strength ?
- Gagnez du temps : Plus besoin de changer d’échelle temporelle ou de calculer les fermetures de bougies mentalement.
- Tradez en confiance : Voyez instantanément si le marché gagne ou perd du momentum.
- Aspect professionnel : Panneau propre et moderne qui s’adapte à tout style de graphique.
- Facile à utiliser : Plug & play, pas besoin de coder.
Note :
Cette démo est uniquement à des fins d’évaluation.
Si vous aimez l’indicateur, veuillez acheter la version complète pour une utilisation illimitée.
Pour obtenir la version complète, recherchez "Candle Timer & Strength" dans la boutique cTrader.
Voir tous mes indicateurs et bots :
https://ctrader.com/pl?search=kobud.222&u=kobud.222
http://www.youtube.com/@Robi22-22
📩 Questions ? Suggestions ? Remise ?
Contact disponible dans mon profil : Robikobud
Résumé
Résumé IA
Candle Timer & Strength Demo for cTrader is an indicator designed to display real-time countdowns to the close of current candles across up to five customizable timeframes. It provides a clear panel showing the remaining time until candle close and the candle’s strength as a percentage, ranging from -100% (strong bearish) to +100% (strong bullish), based on the candle’s close position relative to its range. The panel is fully customizable, allowing users to adjust font size, vertical spacing, distance from the last candle, and select preferred timeframes such as M1, M5, M15, M30, H1, and H4. Colors dynamically indicate momentum: green for strong bullish, red for strong bearish, and white for neutral. The panel remains always visible on the chart, facilitating quick assessment of market timing and momentum. This tool is suited for scalpers, day traders, and multi-timeframe traders seeking precise candle timing and momentum insights to improve entry and exit decisions. Parameters include font size, spacing, timeframe selection, and H4 start hour adjustment for brokers with non-standard candle timings. This demo version is intended for evaluation purposes.
Profil de l'indicateur
Avis clients
0.0
Avis : 0
Avis clients
Il n'y a pas encore d'avis sur ce produit. Vous l'avez déjà essayé ? Soyez le premier à en parler aux autres !
Discussion
Questions fréquentes
Les produits disponibles sur cTrader Store, notamment les bots de trading, les indicateurs et les plug-ins, sont fournis par des développeurs tiers et mis à disposition à titre informatif et à des fins d'accès technique uniquement. cTrader Store n'est pas un courtier et ne fournit aucun conseil en investissement, aucune recommandation personnelle ni aucune garantie quant aux performances futures.
Plus de cet auteur


![Logo de "[Hamster-Coder] Pivot Points (Demo)"](https://cdn.ctrader.com/image/webp/87b54299-8c73-4942-9207-4bc6db824811_31153)


Prix
Depuis le 31/12/2024
7
Ventes
1.13K
Installations gratuites