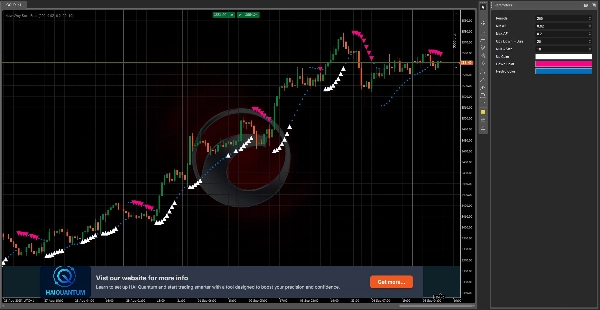
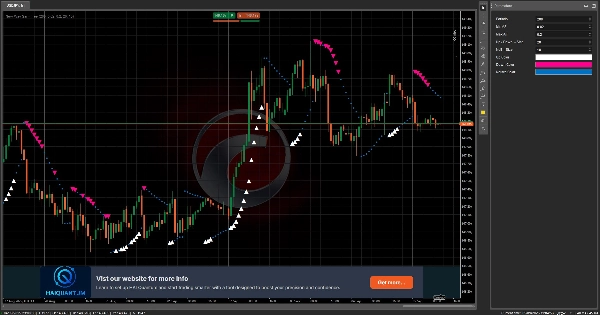
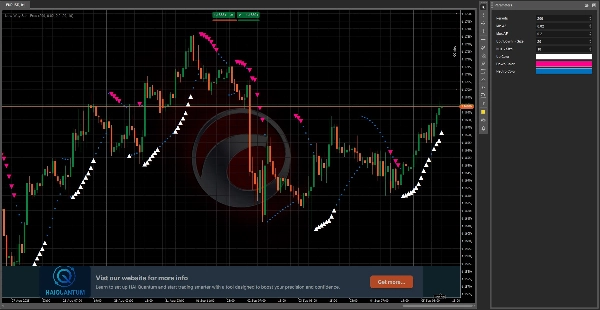
Indicateur
Indices
Prop
Commodities
Stocks
Forex
Signal
Supertrend
Crypto
New Way Sar - Free
Logo de "New Way Sar - Free"
5.0
23/09/2025
65
Desktop
Image mise en ligne de "New Way Sar - Free"Image mise en ligne de "New Way Sar - Free"Image mise en ligne de "New Way Sar - Free"

The Parabolic SAR, or "Stop and Reverse," is a dynamic technical analysis tool that helps traders identify potential trend reversals and set trailing stop-loss orders. Unlike traditional indicators, the Parabolic SAR creates a series of dots that follow the price movement, adjusting as the trend gains momentum.

Our modern version offers a fresh, intuitive approach to this classic indicator. By combining powerful, reliable signals with a clean and modern design, it helps traders easily visualize trend direction and potential entry or exit points. Whether you're a seasoned trader or just starting out, the Parabolic SAR: Modern Version provides the clarity and precision you need to navigate the markets with confidence.

5.0
Avis : 1
5
100 %
4
0 %
3
0 %
2
0 %
1
0 %
Avis clients
October 8, 2025
A fresh twist on the classic SAR! ⚙️ Fast, light, and easy to read. Great for spotting quick trend flips, but add filters to avoid false turns on choppy markets."
Plus de cet auteur
VWAP-Free
VWAP only timeframe
Indicateur
NAS100
NZDUSD
XAUUSD
+10
MarketSession-MX
😎Read the description before purchasing💩
Indicateur
Indices
Prop
Commodities
+3
4MA
This indicator consists of 3 moving averages that can be configured to your liking, from the type of moving average....
Indicateur
Grid
NAS100
NZDUSD
+15
RangeBoxLevel
This technical analysis indicator provides information on market sentiment, trend and price levels....
cBot
Commodities
MACD
SparrowBot-FreeTrial-V2
This bot can automatically generate buy and sell orders based on three specific Fixed bugs
Indicateur
Stocks
Forex
MACD
MACDVolume
😎Read the description before purchasing💩
Indicateur
Grid
NAS100
NZDUSD
+16
AllPattern
🔍 Discover All Candlestick Patterns… Absolutely Free!
Indicateur
Grid
NAS100
NZDUSD
+15
RangeBoxFibonacci
With this Fibonacci retracement indicator, traders have full control over the retracement levels displayed on the chart.
Indicateur
NAS100
NZDUSD
XAUUSD
+11
SessionOne
Session One is a tool for marking from to, useful if you've set the hours you want to trade
Plug-in desktop
Breakout
Signal
RiskRewardCalculator
The Risk-Reward plugin is a tool to visualize a trading idea based on other analysis tools,
Indicateur
Indices
RSI
Commodities
+1
OrderPrice-V3
A straightforward yet effective tool signals entry points for both buying and selling. Include 3 Moving Average
Indicateur
Grid
Indices
Prop
+8
TSPivotSMC
Pivot Point MultiTimeFrame with Order Block
Indicateur
Indices
Prop
Breakout
+7
NTNPICLL
NTNPICLL is a tool to check the best trading hours for the assets and also includes the highest and lowest point
Indicateur
Indices
Prop
Stocks
+4
Pivot Point Smart Money Concept
Transform your approach to trading with our innovative Pivot Point Indicator.
Indicateur
RSI
Indices
Stocks
+3
FiboTrend-Pro
😎Read the description before purchasing💩
Indicateur
Grid
NAS100
NZDUSD
+15
TS_Pivot
Those who are involved in trading know how important it is to take into account the previous session. With Order Block
Indicateur
NAS100
RSI
NZDUSD
+18
HAIQuantum-V10
The HAI Quantum V10 is an advanced indicator designed for technical analysis
Indicateur
RSI
Indices
Stocks
+3
FiboTrend-Pro V2
New version of one of my favorites includes Fibonacci and moving average convergence divergence lines
Vous pourriez aussi aimer
Indicateur
Breakout
Institutional Flow Radar
Institutional Flow Radar scans the chart for abnormal volume events and classifies them into two groups: Capital &Public
Indicateur
NAS100
NZDUSD
XAUUSD
+10
AutoFib Navigator
Automatically plots Daily and Weekly Fibonacci retracements with smart redraw and session control.
Free Volume Profile v2.0
smma tel
Wstęgi HTS 33 144 mobile
Indicateur
Grid
NAS100
NZDUSD
+13
Standard Deviation Channel
Visualize trends with Standard Deviation Channel! Display median, and add customizable upper/lower deviation channels.
Indicateur
NAS100
Indices
XAUUSD
+2
AlgoCorner DonchianPSAR
Visualize market asymmetry like never before — steady climbs meet sudden drops with the Donchian PSAR
Indicateur
NAS100
NZDUSD
XAUUSD
+10
Candle Count
Label each candle sequentially with flexible session resets.
Pivot Points
Pivot Points Indicator
Market Sessions Advanced
Advanced Market Sessions with ICT killzones
Pivot Points Clasic,FIBO,etc
All-in-one Pivot Indicator: set Classic, Fibo, Woodie, Camarilla, Demark methods, style levels & labels your way ;)
Time To Break Even Indicator v2
Time To Break Even Indicator. This indicator helps you time your trade's entry.
Indicateur
VWAP
RSI
Breakout
+7
Anchored VWAP by LudwigICT
📈 Anchored VWAP with auto High/Low, session resets, Daily VWAP & TWAP — precise, Pine-accurate port.
Indicateur
Grid
NZDUSD
Breakout
+16
vWAP Free
Editions: Free (core VWAP + bands) · Pro (multi‑VWAP, click‑to‑anchor, alerts).
FVG_OrderBlock
FVG Order Blocks Pro - Institutional-grade Fair Value Gap detection with smart order block analysis.
Indicateur
NAS100
NZDUSD
XAUUSD
+10
Moving Average PRO
Customize your Moving Average! Choose any timeframe and price source for precision and flexibility in your analysis.
Indicateur
Breakout
ATR
Signal
[Stellar Strategies] Market Structure Breakout
Flags breakouts of recent highs/lows on cTrader charts. Shows arrows/lines. Optional trend filter & sound alerts 📉📈
overbought oversold
Overbought Oversold Indicator
Indicateur
RSI
Breakout
XAUUSD
+6
Fair Value Gap Sessions
identify and highlight temporary market inefficiencies known as "fair value gaps" 🚨 within specific trading Sessions.