
Description
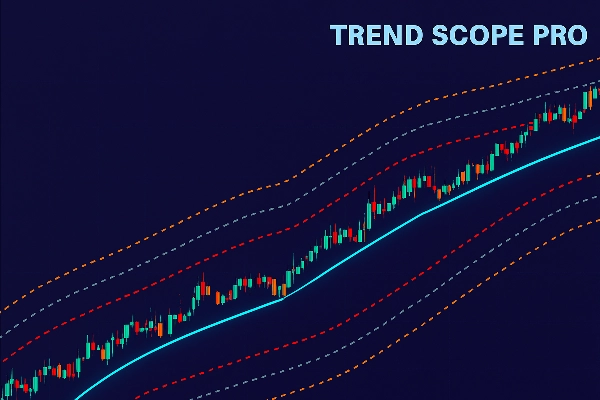
Trend Scope Pro est un indicateur technique de qualité professionnelle conçu pour offrir aux traders une compréhension approfondie de la structure du marché et de la direction des prix. Basé sur des algorithmes avancés de régression linéaire, cet outil calcule une ligne de régression dynamique ainsi que trois niveaux de canaux d'écart-type. En combinant précision statistique et clarté visuelle, il vous aide à identifier facilement les tendances actuelles du marché, les zones potentielles de retournement et les plages de volatilité, en faisant un ajout accessible mais puissant à toute boîte à outils de trading.
Comment lire Trend Scope Pro
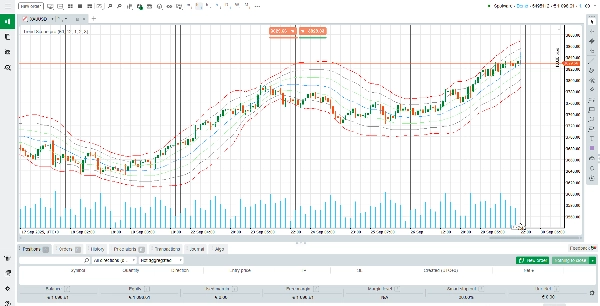
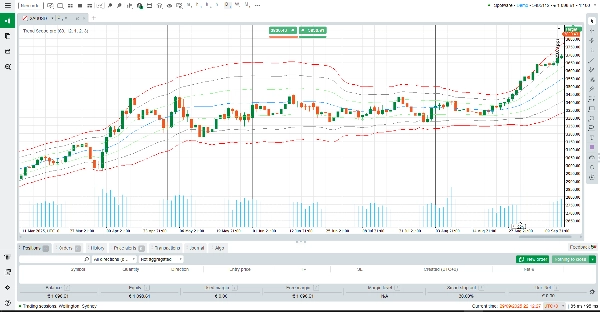
Lorsqu'il est appliqué à votre graphique, Trend Scope Pro trace une ligne de régression centrale (bleue), qui représente la « juste valeur » ou la direction moyenne de la tendance sur une période définie. Autour de cette ligne, trois ensembles de canaux supérieurs et inférieurs sont tracés (orange, gris et rouge). Chaque canal est calculé en utilisant un multiplicateur d'écart-type différent :
Supérieur/Inférieur 1 (Orange) : Représente le premier écart-type. Les mouvements de prix dans cette zone reflètent souvent la volatilité normale à court terme.
Supérieur/Inférieur 2 (Gris) : Marque des écarts plus forts. Atteindre cette zone signale souvent un mouvement prolongé ou un momentum en développement.
Supérieur/Inférieur 3 (Rouge) : Zones extrêmes où le marché peut être suracheté ou survendu, créant des opportunités potentielles de retournement.
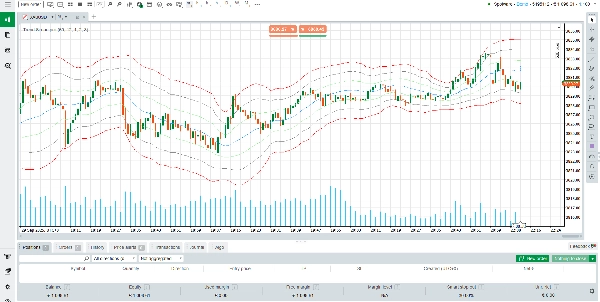
En pratique, les traders peuvent utiliser la ligne de régression pour confirmer la direction de la tendance, tandis que les canaux agissent comme des niveaux dynamiques de support et de résistance. Par exemple :
Si le prix reste constamment au-dessus de la ligne de régression, la tendance est haussière.
Si le prix teste ou casse à plusieurs reprises la ligne de régression vers le bas, la tendance s'affaiblit.
Les touches extrêmes aux canaux rouges peuvent mettre en évidence des points d'épuisement, où les retournements ou les replis sont plus probables.
Comment fonctionne l'indicateur
Trend Scope Pro calcule une ligne de régression en analysant les prix de clôture sur une période de référence choisie. Il mesure ensuite l'écart-type des prix par rapport à cette ligne, ce qui détermine la largeur de chaque canal. Cette approche statistique garantit que l'indicateur s'adapte à la volatilité en temps réel, offrant un équilibre entre signaux de suivi de tendance et indications de retour à la moyenne.
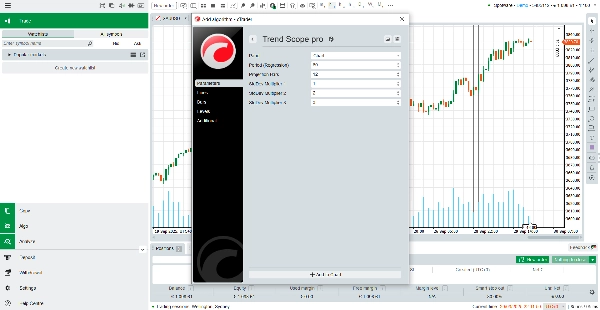
Les paramètres par défaut (60 barres en arrière, multiplicateurs 1.0, 2.0, 3.0) sont optimisés pour la plupart des instruments, mais vous pouvez facilement les ajuster pour correspondre à votre stratégie ou à votre période. Que vous soyez un trader intraday cherchant des entrées à court terme, ou un trader de swing analysant des cycles de marché plus larges, Trend Scope Pro fournit un contexte fiable pour la prise de décision.
Principales caractéristiques de Trend Scope Pro
Régression linéaire adaptative – Calcule dynamiquement la tendance centrale du marché pour un biais directionnel précis.
Canaux à plusieurs niveaux – Trois ensembles de bandes de déviation aident à identifier les mouvements normaux, les tendances fortes et les conditions extrêmes.
Clarté visuelle – Des lignes nettes et codées par couleur facilitent l'interprétation de l'action des prix en un coup d'œil.
Paramètres personnalisables – Périodes de référence flexibles et multiplicateurs de déviation pour s'adapter à tout style de trading.
En résumé, Trend Scope Pro combine fiabilité statistique et utilisabilité pratique. Ce n'est pas seulement une ligne de tendance — c'est un cadre complet pour analyser le comportement des prix, identifier des zones à haute probabilité et améliorer le timing des trades. Que vous cherchiez une confirmation de la tendance, anticipiez des retournements ou ajoutiez simplement de la structure à vos graphiques, Trend Scope Pro offre la clarté et la confiance dont vous avez besoin.
Résumé
Avis clients
5 | 50 % | |
4 | 50 % | |
3 | 0 % | |
2 | 0 % | |
1 | 0 % |


