
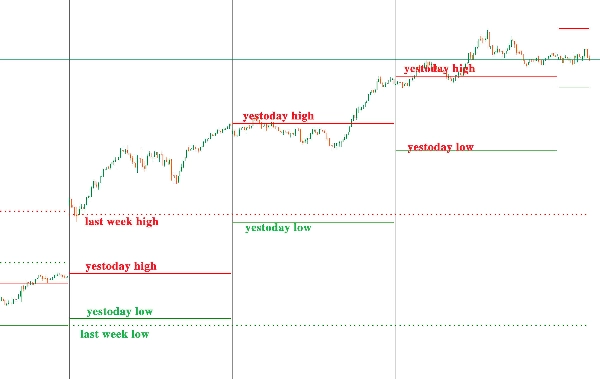
L'indicateur « Niveaux Quotidiens » est utilisé pour afficher les plus hauts/bas de la semaine dernière et les plus hauts/bas d'hier sur différentes périodes.
Plus haut/bas de la semaine dernière : Marqué par des lignes pointillées épaisses ;
Plus haut/bas d'hier : Marqué par des lignes continues fines.
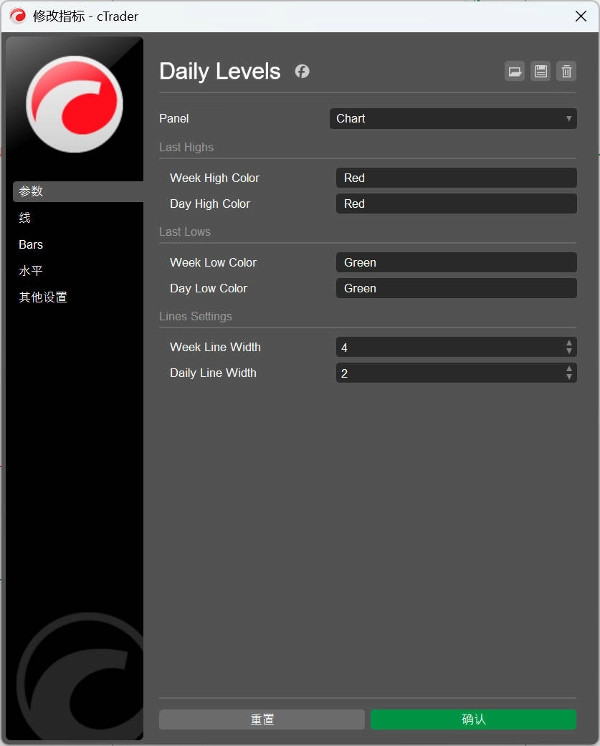
Les utilisateurs peuvent personnaliser les couleurs et l'épaisseur des lignes.
“Daily Levels”指标用于在不同的时框框架下显示上周最高价/最低价和昨天最高价/最低价。
上周最高/最低价:使用粗虚线标注;
昨天最高/最低价:使用细实线标注。
用户可以自定义颜色和线条粗细。
Profil de l'indicateur
0.0
Avis : 0
Avis clients
Il n'y a pas encore d'avis sur ce produit. Vous l'avez déjà essayé ? Soyez le premier à en parler aux autres !
Forex
Signal
Breakout
Indices
Commodities
Crypto
Les produits disponibles sur cTrader Store, notamment les bots de trading, les indicateurs et les plug-ins, sont fournis par des développeurs tiers et mis à disposition à titre informatif et à des fins d'accès technique uniquement. cTrader Store n'est pas un courtier et ne fournit aucun conseil en investissement, aucune recommandation personnelle ni aucune garantie quant aux performances futures.


Depuis le 30/09/2024
44
Ventes