
Description
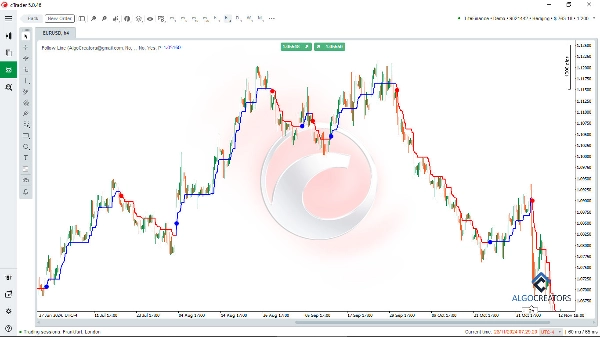
L'indicateur Follow Line est un puissant indicateur cTrader pour l'analyse technique, aidant les traders à identifier les points d'entrée et de sortie optimaux sur les marchés financiers. En combinant les Bandes de Bollinger et l'indicateur ATR, il filtre les tendances et fournit des signaux d'achat et de vente fiables.
Avec cet indicateur, vous pouvez facilement repérer les tendances haussières ou baissières du marché et suivre des signaux à haute confiance.
Les traders peuvent combiner l'indicateur Follow Line avec des outils avancés comme l'indicateur Smart Money Assistant de cTrader et les oscillateurs tels que le MACD pour améliorer leur analyse et confirmer les entrées de trades.
Ses réglages personnalisables et ses alertes en temps réel en font un ajout précieux à toute stratégie de trading, permettant aux utilisateurs d'exécuter des trades réussis avec confiance et précision.
Caractéristiques clés :
- Détection de tendance : Utilisez Follow Line pour identifier les tendances haussières ou baissières du marché.
- Signaux d'achat/vente : Affiche des signaux d'achat et de vente précis basés sur les cassures des Bandes de Bollinger.
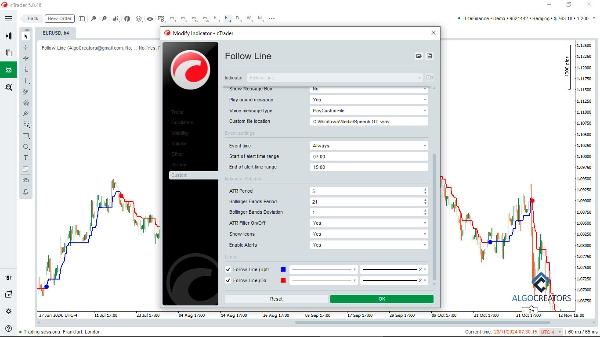
- Filtre ATR : Option pour activer ou désactiver le filtre ATR pour une meilleure précision des signaux.
- Réglages personnalisables : Ajustez la période des Bandes de Bollinger, l'écart-type et la période de l'ATR.
- Représentation visuelle : Affichez les signaux sur le graphique à l'aide d'icônes intuitives (flèches ou lignes).
- Alertes : Recevez des alertes instantanées dès qu'un signal d'achat ou de vente apparaît.
Cet indicateur est hautement personnalisable, permettant aux traders d'ajuster les périodes des Bandes de Bollinger, les écarts-types et les réglages ATR pour s'adapter à leur stratégie. Les indices visuels et les alertes instantanées le rendent convivial et efficace tant pour le scalping que pour le swing trading. Avec des fonctionnalités telles que la détection de tendance, la gestion des risques et les réglages personnalisables, l'indicateur Follow Line est idéal pour les traders forex, cryptomonnaies et actions souhaitant améliorer leur analyse technique et leurs performances de trading.
Parfait pour identifier des opportunités de marché précises !
Résumé
Users can customize settings such as Bollinger Bands period, standard deviation, and ATR period to align with their trading strategies. The indicator visually represents signals on the chart using intuitive icons like arrows or lines and provides real-time alerts when signals occur. It supports various trading styles, including scalping and swing trading, and is suitable for forex, cryptocurrency, and stock markets.
The Follow Line indicator can be combined with other tools like the cTrader Smart Money Assistant and MACD oscillators to confirm trade entries and enhance analysis. Its customizable features and alert system assist traders in identifying precise market opportunities and managing risk effectively.
Avis clients
5 | 60 % | |
4 | 20 % | |
3 | 20 % | |
2 | 0 % | |
1 | 0 % |


