
Deskripsi
📌 Tren Filter Kalman – Ikhtisar & Ulasan
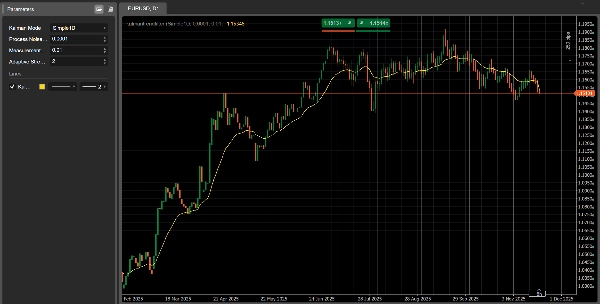
Tren Filter Kalman adalah indikator lanjutan yang mengikuti tren untuk cTrader, dirancang untuk memberikan garis tren yang halus dan sangat responsif dengan lag yang jauh lebih sedikit dibandingkan rata-rata bergerak tradisional.
Di mana filter SMA/EMA klasik bereaksi lambat dan sering melewatkan perubahan tren awal, Filter Kalman:
- Terus memperbarui perkiraan harga “sebenarnya”
- Menyeimbangkan kelancaran dan responsivitas secara matematis
- Beradaptasi dengan volatilitas (mode Adaptif)
- Memodelkan baik harga dan kecepatan (mode 2D)
Ini menjadikannya alat yang kuat untuk trader manual maupun pengembang sistem otomatis.
🎛 Mode & Parameter
Mode Kalman (3 Versi dalam Satu Indikator)
1️⃣ Simple1D
Filter Kalman 1D klasik.
Cepat, bersih, dan sangat baik untuk deteksi tren jangka pendek.
2️⃣ PositionVelocity2D
Memodelkan baik harga dan kecepatan tren.
Ideal sebagai filter arah dalam strategi algoritmik.
3️⃣ Adaptive1D
Secara otomatis menyesuaikan dengan volatilitas.
Lebih reaktif di pasar cepat, lebih halus di kondisi tenang.
🧩 Penjelasan Parameter Kunci
- Noise Proses (Q):
Semakin tinggi = reaksi tren lebih cepat, semakin rendah = garis lebih halus. - Noise Pengukuran (R):
Semakin tinggi = filter kurang mempercayai data → hasil lebih halus. - Kekuatan Adaptif:
Hanya digunakan di Adaptive1D. Mengontrol seberapa kuat volatilitas memengaruhi filter.
📈 Cara Menginterpretasikan Sinyal
1. Mendeteksi Arah Tren
- Uptrend: Garis miring ke atas, harga bertahan di atas filter.
- Downtrend: Garis miring ke bawah, harga bertahan di bawah filter.
- Datar: Pasar sedang sideways, hindari strategi breakout.
2. Sinyal Masuk (Logika Crossover)
Masuk Bullish:
- Harga menutup di atas garis Kalman
- Garis mulai berbelok ke atas
Masuk Bearish:
- Harga menutup di bawah garis Kalman
- Garis mulai berbelok ke bawah
3. Kekuatan Tren (Mode 2D)
Kemiringan menjadi bacaan langsung dari momentum:
- Kemiringan naik kuat → tren bullish kuat
- Kemiringan turun kuat → tren bearish kuat
- Kemiringan mendatar → tren melemah atau fase transisi
📊 Contoh Penggunaan Praktis
✔ Strategi Mengikuti Tren
Gunakan Simple1D atau Adaptive1D:
- Beli di atas garis saat kemiringan menjadi positif
- Jual di bawah garis saat kemiringan menjadi negatif
✔ Pendekatan Multi-Timeframe
- Gunakan Kalman di H1 untuk arah
- Gunakan Kalman di M15 untuk entri presisi
- Masuk hanya sesuai arah yang ditunjukkan oleh timeframe yang lebih tinggi
✔ Integrasi Bot
Sempurna untuk trading algoritmik:
- Izinkan hanya posisi beli jika kemiringan > 0
- Izinkan hanya posisi jual jika kemiringan < 0
- Gunakan Adaptive1D untuk indeks volatil seperti US500, NAS100, US2000
🌟 Bergabung dengan Komunitas Kami
Jika Anda ingin akses ke:
- Optimasi eksklusif untuk setiap bot kami
- Tips konfigurasi lanjutan
- Peningkatan trading
- Bantuan teknis yang dipersonalisasi
- Pembaruan dan alat baru
👉 Bergabunglah dengan komunitas kami dengan mengklik tautan di halaman profil saya.
Di sana Anda akan menemukan pengaturan optimasi terbaik untuk semua bot kami, yang diperbarui secara rutin.
Ringkasan
Ulasan pelanggan
5 | 0 % | |
4 | 100 % | |
3 | 0 % | |
2 | 0 % | |
1 | 0 % |


![Logo "[Hamster-Coder] Bollinger Bands"](https://cdn.ctrader.com/image/webp/21d8e5d6-fb11-4bac-b9ee-cd05c2b76804_30327)


![Logo "[Hamster-Coder] Pivot Points MTF"](https://cdn.ctrader.com/image/webp/4c143e5a-309c-40e3-a578-f04d1e133ffa_31159)
