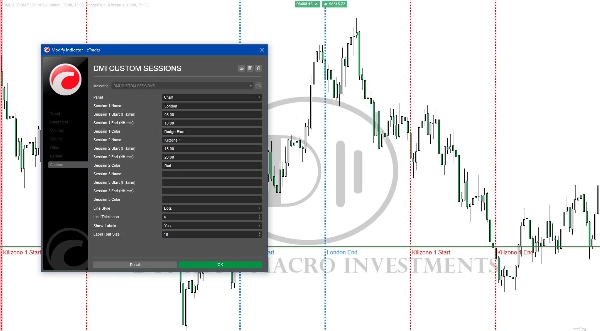
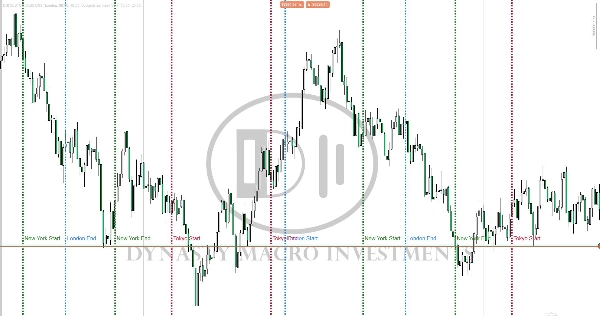
Courtiers & props
Pour entreprise
00
Days
:
00
Hours
:
00
Minutes
:
00
Seconds
DMI CUSTOM SESSIONS
Logo de "DMI CUSTOM SESSIONS"
03/09/2025
Desktop
Depuis le 11/12/2024
Ventes
1
Image mise en ligne de "DMI CUSTOM SESSIONS"Image mise en ligne de "DMI CUSTOM SESSIONS"

This will allow you to have SESSIONS on the chart. London, New York, Asian session and you can customize the times. You can give the session unique names and change the colors.

0.0
Avis : 0
Avis clients
Il n'y a pas encore d'avis sur ce produit. Vous l'avez déjà essayé ? Soyez le premier à en parler aux autres !
Plus de cet auteur
DMI 3 bar v2
Shows BUY & SELL signals for 3 & 4 BAR PATTERN (Morning star/ Evening star). It is adjustable and it will SHOW ARROWS.
DMI MONDAY ZONES v2.1
Marks Monday's OPEN,HIGH & LOW. These are areas of support and resistance for the week.
Morning Star On Chart
Morning Star pattern on chart (Bullish and Bearish) automatically marked with (BUY & SELL) Very powerful signals.
Vous pourriez aussi aimer
Indicateur
NAS100
NZDUSD
XAUUSD
+10
MarketSession-MX
😎Read the description before purchasing💩
Indicateur
NAS100
NZDUSD
XAUUSD
+16
Swing AVWAP Pro
Adaptive Swing-Anchored VWAP that tracks market structure shifts with precision and clarity.
Indicateur
NAS100
NZDUSD
XAUUSD
+15
VWAP Multi Chart type
Pro M1 VWAP: Daily/Weekly/Monthly anchors with optional bands, editable colors & thickness—accurate on any chart.
Indicateur
Indices
Stocks
Commodities
+2
Custom Timeframes
Custom and native timeframes display with OHLC lines, moving averages, and Fibonacci levels.
Indicateur
Indices
Commodities
Stocks
+2
Liquidity-Based Support Resistance
Structural analysis framework designed to quantify swing point behavior at psychological price levels
Indicateur
Indices
Breakout
Prop
+6
Price Level DWM BT
Price Level DWM BT
Indicateur
NAS100
NZDUSD
XAUUSD
+11
Market Info bY MohammadKHR
Daily High & Low with live Percentage change.
Indicateur
NAS100
Indices
Prop
+6
WHT AMF
Adaptive Median Filter calculates price median to eliminate noise and extreme values.
IR VLine
don't move to the end of chart after timeframe changing. it should be better to use for near history. for long history
Indicateur
Breakout
Signal
SMC
Free_ICT Breakers_BOS_MSS_withSourceCode
ICT Breakers (BOS/MSS) - Professional market structure and breakout detection tool.
Indicateur
RSI
Breakout
Signal
+1
Dynamic Trend Gradient
Identifies trends with moving averages & volatility. Base levels = bullish 🐂 or bearish 🐻 signals. Reversals detected!
Drawing Utility
A rectangular box with 5 adjustable Fibonacci level or even custom ones.