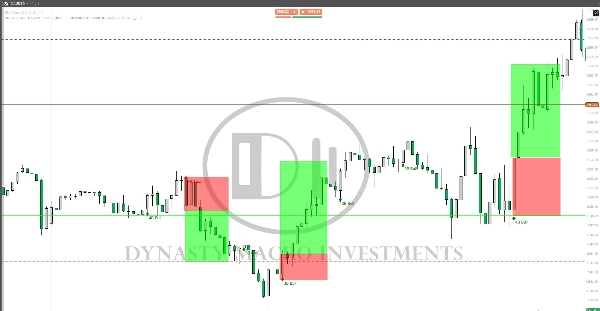
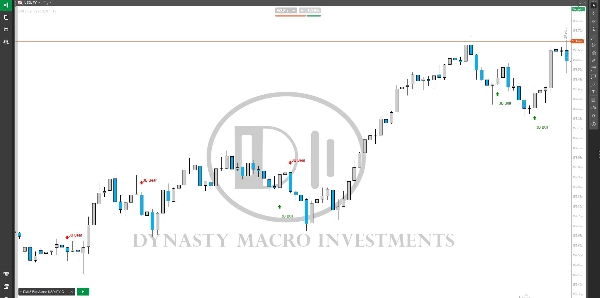
Logo de "Morning Star On Chart"
Morning Star On Chart
Image mise en ligne de "Morning Star On Chart"

Morning Star pattern on chart (Bullish and Bearish) automatically marked with (BUY & SELL) Very powerful signals.

Indicator profile
0.0
Avis : 0
Avis clients
Il n'y a pas encore d'avis sur ce produit. Vous l'avez déjà essayé ? Soyez le premier à en parler aux autres !
Products available through cTrader Store, including trading bots, indicators and plugins, are provided by third-party developers and made available for informational and technical access purposes only. cTrader Store is not a broker and does not provide investment advice, personal recommendations or any guarantee of future performance.

Plus de cet auteur

Shows BUY & SELL signals for 3 & 4 BAR PATTERN (Morning star/ Evening star). It is adjustable and it will SHOW ARROWS.
This will allow you to have SESSIONS on the chart. London, New York, Asian session and you can customize the times.
Marks Monday's OPEN,HIGH & LOW. These are areas of support and resistance for the week.

Vous pourriez aussi aimer

Basic & FREE. Plots New York Initial Balance (NY local time) and projects IB High, IB Low, and midline.
The EMA Trend Simple is a trend-following tool designed for simplicity and visual clarity.
MAMA/FAMA centerline with elastic energy bands and snap-back reversal signals. Adaptive width. Built-in panel.
Pivot Points Standard — All-in-One Multi-Timeframe Pivot Indicator for cTrader
Order Block Detector is built to spot and display Order Blocks on chart, often triggering strong price reactions.
Smart fractal + ZigZag with fully automated Fibonacci levels for precise swing and structure trading.
DecisionGate is a context-based trade permission indicator for cTrader. It helps you avoid low-quality trades by evaluat
The FZ indicator draws Fibonacci channel zones based on the highest and lowest prices over a user-defined period.
Technical self-analysis, WITH SOUND ALERT
The Darvas Box involves identifying "boxes" or trading ranges where a stock's price consolidates before breaking out.
A comprehensive workflow‑enhancement toolkit designed to make charting on cTrader smoother, clearer, and more efficient.
Premium FTMO-ready dashboard. Spots exact reversals, filters fakeouts, and gives precise Price Action entry levels.
Regression Channel plots dynamic upper/lower bands around price to highlight trend direction, volatility, and potential
Coral indicator
Where price swings, volume speaks
AI-powered KNN machine learning indicator for cTrader. Features dynamic ATR targets, trend filters & Telegram alerts.
Price Level DWM BT
🔹 Advanced RSI with smart alerts and visual signals for faster trend reversal detection.