Description
Qu'est-ce qu'un Fair Value Gap ?
Un Fair Value Gap (FVG) est un concept puissant d'action des prix utilisé par les traders institutionnels et les passionnés de Smart Money. Il représente un déséquilibre ou une inefficacité sur le marché où le prix a bougé si rapidement qu'il a laissé un "écart" - une zone avec une activité de trading minimale. Ces écarts agissent souvent comme de fortes zones de support/résistance et sont fréquemment "comblés" lorsque le prix revient chercher de la liquidité.
Cet indicateur détecte, suit et visualise automatiquement ces zones de trading à haute probabilité sur vos graphiques.
Caractéristiques principales
🎯 Détection automatique des FVG
- FVG haussiers : Identifie automatiquement les écarts de prix à la hausse qui agissent souvent comme zones de support
- FVG baissiers : Détecte les écarts de prix à la baisse qui servent fréquemment de résistance
- Mises à jour en temps réel : Analyse continuellement l'action des prix à mesure que de nouvelles barres se forment
- Filtre de taille minimale d'écart : Filtre personnalisable pour ignorer les écarts insignifiants (défini en pips)
📊 Excellence visuelle
- Zones codées par couleur : Couleurs distinctes pour les écarts haussiers (vert) et baissiers (rouge)
- Niveaux de transparence : Opacité ajustable pour les écarts comblés vs non comblés
- Étiquettes claires : Identification claire de chaque type de FVG directement sur le graphique
- Design professionnel : Visualisation non intrusive qui améliore la clarté du graphique
🎪 Mise en évidence de la zone d'entrée
- Zones d'entrée optimales : Marque automatiquement les 50 % les meilleurs de chaque FVG pour les entrées
- Zones d'achat/vente : Zones clairement étiquetées montrant où chercher les trades
- Positionnement intelligent : Zones d'entrée positionnées pour des configurations à probabilité maximale
- Activation/désactivation : Désactivez les zones d'entrée si vous préférez un affichage minimal du graphique
⚡ Suivi du comblement
- Détection automatique : Suit quand le prix comble (revient à) chaque écart
- Retour visuel : Les écarts comblés deviennent plus transparents pour réduire l'encombrement
- Historique : Conserve l'historique des écarts comblés pour analyse
- Étiquettes de statut : Affiche le tag "Comblé" sur les écarts terminés
🎛️ Personnalisation étendue
Options d'affichage
- FVG récents uniquement : Option pour afficher uniquement les écarts les plus récents (réduit l'encombrement du graphique)
- Périodes configurables : Définissez le nombre de barres récentes pour afficher les écarts
- Extension de zone : Contrôlez jusqu'où les zones se projettent dans le futur
- Taille de la police : Taille du texte des étiquettes ajustable (6-20)
Personnalisation visuelle
- Couleurs personnalisées : Choisissez n'importe quelle couleur pour les FVG haussiers et baissiers
- Contrôle de l'opacité : Réglez la transparence de 1 à 100 %
- Affichage des zones d'entrée : Activez/désactivez les zones d'entrée
- Fusion des zones qui se chevauchent : Option pour combiner les zones qui se chevauchent
Optimisation des performances
- Intervalle de nettoyage : Configure la fréquence de gestion de la mémoire
- Taille minimale d'écart : Filtre les écarts selon la taille en pips
- Rendu intelligent : Redessine uniquement lorsque les zones changent (performance optimisée)
Applications de trading
1. Trading support & résistance
- Utilisez les FVG haussiers comme niveaux de support pour les entrées longues
- Utilisez les FVG baissiers comme niveaux de résistance pour les entrées courtes
- Attendez que le prix revienne aux zones FVG avant d'entrer en position
2. Trading de tendance
- En tendance haussière, achetez lorsque le prix revient vers les FVG haussiers
- En tendance baissière, vendez lorsque le prix remonte vers les FVG baissiers
- Utilisez les FVG comme points d'entrée de continuation
3. Captures de liquidité
- Identifiez où les teneurs de marché peuvent revenir pour combler des ordres
- Tradez le "comblement" des FVG significatifs
- Combinez avec des blocs d'ordres pour des configurations à haute probabilité
4. Analyse multi-timeframe
- Identifiez les FVG sur des timeframes supérieurs (H4, D1)
- Entrez en position sur des timeframes inférieurs lorsque le prix atteint les FVG HTF
- Empilez plusieurs FVG de différents timeframes pour les zones les plus fortes
5. Gestion des risques
- Utilisez les limites des FVG pour placer les stops loss
- Visez les FVG opposés pour les niveaux de take profit
- Dimensionnez les positions en fonction de la largeur de la zone FVG
Spécifications techniques
Performance
- Algorithme optimisé : Chaque barre est traitée une seule fois (10-20x plus rapide que les indicateurs typiques)
- Dessin incrémental : Redessine uniquement les zones modifiées (95 % d'opérations de dessin en moins)
- Efficace en mémoire : Nettoyage automatique des anciennes zones
- Scalable : Fonctionne efficacement sur n'importe quel timeframe et instrument
Compatibilité
- Timeframes : Tous les timeframes supportés (M1 à MN)
- Instruments : Fonctionne sur Forex, Indices, Matières premières, Cryptomonnaies, Actions
- Version cTrader : Compatible avec cTrader 4.x et supérieur
- Aucune dépendance : Indicateur autonome, aucune bibliothèque externe requise
Logique de détection
- Motif 3 barres : Analyse trois barres consécutives pour la formation d'écarts
- Zones validées : Garantit que tous les écarts détectés ont des limites supérieures/inférieures valides
- Prévention des doublons : Système basé sur HashSet pour éviter les détections redondantes
- Gestion des erreurs : Blocs try-catch complets assurant la stabilité
Guide des paramètres
ParamètreDéfautDescription
Taille minimale d'écart (pips)
2
Filtre les écarts plus petits que cette valeur
Couleur FVG haussier
LimeGreen
Couleur pour les écarts à la hausse
Couleur FVG baissier
Red
Couleur pour les écarts à la baisse
Opacité
20
Niveau de transparence (1-100)
Afficher les zones d'entrée
True
Affiche les zones d'entrée optimales
Extension de zone (barres)
50
Distance de projection des zones vers l'avant
Mettre en évidence uniquement les FVG récents
True
Afficher uniquement les écarts récents
Périodes récentes
20
Nombre de barres récentes à afficher
Taille de la police
8
Taille des étiquettes de zone
Intervalle de nettoyage
100
Fréquence de gestion de la mémoire
Fusionner les zones qui se chevauchent
False
Combiner les écarts qui se chevauchent
Conseils d'utilisation
Pour bien commencer
- Ajouter au graphique : Glissez l'indicateur sur n'importe quel graphique
- Définir l'écart minimum : Ajustez selon la volatilité de l'instrument
-
- Forex majeurs : 2-5 pips
- Indices : 5-10 pips
- Crypto : 10-20 pips
- Personnaliser les couleurs : Adaptez au thème de votre graphique
- Activer les zones d'entrée : Activez pour la planification des trades
Bonnes pratiques
- Combiner avec la tendance : Tradez les FVG dans la direction de la tendance principale
- Attendre la confluence : Utilisez avec support/résistance ou moyennes mobiles
- Respecter la zone : Ne pas courir après le prix, attendez qu'il revienne au FVG
- Prioriser les timeframes supérieurs : Vérifiez les FVG HTF avant d'entrer sur LTF
- Tenir un journal des résultats : Suivez quelles configurations FVG fonctionnent le mieux pour vous
Recommandations de timeframe
- Scalping (M1-M5) : Utilisez Périodes récentes = 10-15
- Day Trading (M15-H1) : Utilisez Périodes récentes = 20-30
- Swing Trading (H4-D1) : Utilisez Périodes récentes = 30-50
- Position Trading (W1-MN) : Affichez tous les FVG (Récents uniquement = Faux)
Paramètres spécifiques à l'instrument
Paires Forex :
- Taille min. d'écart : 2-5 pips
- Extension de zone : 50 barres
- Fonctionne mieux sur les majeurs (EUR/USD, GBP/USD)
Indices boursiers :
- Taille min. d'écart : 5-10 pips
- Extension de zone : 30-50 barres
- Excellent sur US30, SPX500, NAS100
Cryptomonnaies :
- Taille min. d'écart : 10-20 pips
- Extension de zone : 40-60 barres
- La forte volatilité crée de nombreux FVG
Matières premières :
- Taille min. d'écart : 5-10 pips
- Extension de zone : 50 barres
- Fonctionne bien sur XAUUSD (Or)
Qu'est-ce qui rend cet indicateur unique ?
✅ Algorithme de détection précis
Contrairement à de nombreux indicateurs FVG utilisant une logique incorrecte, cet indicateur utilise le motif correct à 3 barres :
- FVG haussier : Écart entre le plus haut de la barre 1 et le plus bas de la barre 3
- FVG baissier : Écart entre le plus bas de la barre 1 et le plus haut de la barre 3
- Zones validées avec garantie top > bottom
✅ Performance optimisée
Conçu dès le départ pour la rapidité :
- Pas de calculs redondants
- Système de dessin incrémental
- Gestion intelligente de la mémoire
- Gère efficacement des milliers de barres
✅ Qualité professionnelle
- Code propre et lisible
- Gestion complète des erreurs
- Journalisation détaillée pour le débogage
- Mises à jour régulières et support
✅ Fonctionnalités orientées trader
- Les zones d'entrée montrent où trader
- Le suivi du comblement réduit la confusion
- Personnalisable pour toute stratégie
- Fonctionne sur tous les instruments/timeframes
Questions fréquentes
Q : Combien de FVG apparaîtront sur mon graphique ? R : Cela dépend du timeframe et de la volatilité. Typiquement 5-15 zones actives. Utilisez "Mettre en évidence uniquement les récents" pour contrôler l'affichage.
Q : Pourquoi certains FVG disparaissent-ils ? R : Lorsque les zones sont comblées ou dépassent la période de nettoyage, elles sont supprimées pour réduire l'encombrement. Ajustez "Périodes récentes" pour les conserver plus longtemps.
Q : Puis-je utiliser ceci pour le trading automatisé ? R : Il s'agit d'un indicateur pour l'analyse visuelle. Pour le trading automatisé, vous devrez créer un cBot qui lit les données FVG.
Q : Est-ce que ça repeint ? R : Non. Une fois qu'une barre se ferme et qu'un FVG est détecté, il reste fixe. Seul le FVG potentiel de la barre en formation peut changer avant la clôture.
Q : Quel est le meilleur timeframe ? R : H1 et H4 fonctionnent bien pour la plupart des traders. Les timeframes supérieurs (D1, W1) montrent des FVG plus forts et plus significatifs.
Q : Comment savoir quels FVG trader ? R : Concentrez-vous sur les FVG qui s'alignent avec la tendance principale, sont les plus proches du prix actuel et présentent une confluence avec d'autres facteurs techniques.
Support & mises à jour
- Documentation : Guide utilisateur complet inclus
- Mises à jour régulières : Amélioration et optimisation continues
- Corrections de bugs : Réponse rapide à tout problème
- Demandes de fonctionnalités : Ouvert aux suggestions des utilisateurs
Ressources éducatives
Apprentissage recommandé
- Étudiez les concepts ICT (Inner Circle Trader)
- Apprenez les concepts Smart Money (SMC)
- Comprenez la structure du marché et la liquidité
- Pratiquez d'abord l'identification manuelle des FVG
Approche pratique
- Entraînement visuel : Repérez manuellement les FVG avant d'utiliser l'indicateur
- Backtest : Analysez les FVG historiques et leurs taux de comblement
- Test en démo : Entraînez-vous à trader les configurations FVG sans risque
- Tenir des registres : Notez quelles configurations fonctionnent pour votre stratégie
Installation
- Téléchargez le fichier
FairValueGapIndicator.cs - Ouvrez cTrader
- Allez dans Automate → Indicateurs
- Cliquez sur "+" pour ajouter un nouvel indicateur
- Sélectionnez le fichier téléchargé
- Cliquez sur "Build"
- Glissez l'indicateur sur le graphique
Avertissement
Cet indicateur est un outil d'analyse technique et ne garantit pas des trades rentables. Tout trading comporte des risques. Les performances passées des FVG identifiés ne garantissent pas les résultats futurs. Utilisez toujours une gestion des risques appropriée, maintenez une taille de position adéquate et ne risquez jamais plus que ce que vous pouvez vous permettre de perdre. Cet outil doit faire partie d'une stratégie de trading complète, et non être utilisé isolément.
Informations sur la version
Version actuelle : 2.0 Dernière mise à jour : Décembre 2024 Compatibilité : cTrader 4.x+ Licence : Gratuit pour usage personnel
Tags
Fair Value Gap, FVG, Smart Money, ICT, Flux d'ordres, Support Résistance, Action des prix, Liquidité, Déséquilibre, Zones de trading, Structure du marché, Trading institutionnel, Offre Demande, Signaux d'entrée
Captures d'écran recommandées
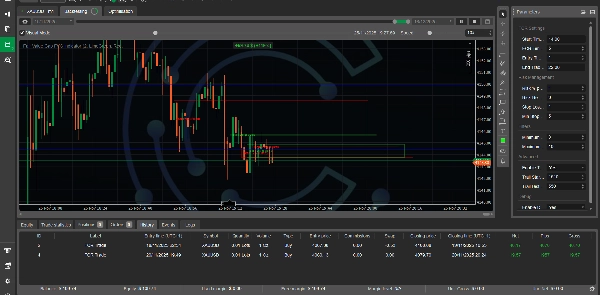
- Vue principale du graphique : Affiche plusieurs FVG avec zones d'entrée
- Exemple de FVG haussier : Tendance claire à la hausse avec support FVG
- Exemple de FVG baissier : Tendance à la baisse avec résistance FVG
- Détection de comblement : Montre avant/après d'un FVG comblé
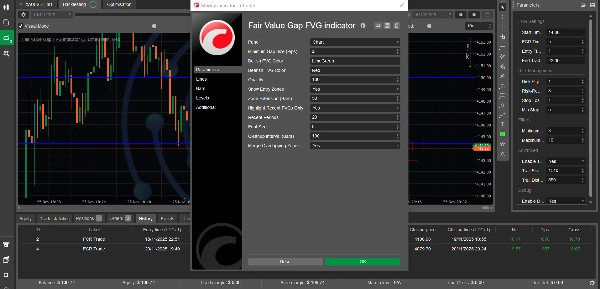
- Panneau des paramètres : Affiche les options de personnalisation
- Multi-timeframe : Même instrument sur différents timeframes
Journal des modifications
Version 2.0 (Décembre 2024)
- ✅ Correction de l'algorithme critique de détection des FVG
- ✅ Mise en œuvre d'optimisations de performance (10-20x plus rapide)
- ✅ Ajout d'un système de dessin incrémental (95 % de redessins en moins)
- ✅ Amélioration de la gestion des erreurs et de la stabilité
- ✅ Ajout de l'option de fusion des zones qui se chevauchent
- ✅ Amélioration de la journalisation et du débogage
- ✅ Optimisation de la gestion de la mémoire
- ✅ Ajout d'une validation complète
Version 1.0 (Première version)
- Détection basique des FVG
- Zones codées par couleur
- Mise en évidence des zones d'entrée
- Suivi du comblement
Résumé
Designed for use on all timeframes and instruments—including Forex, indices, commodities, cryptocurrencies, and stocks—it supports multi-timeframe analysis and offers extensive customization of display options such as gap size filters, zone extension, colors, opacity, and label fonts. Performance optimizations ensure efficient operation with minimal redraws and memory use.
Traders can apply the indicator for support/resistance trading, trend continuation entries, liquidity grabs, and risk management by using FVG boundaries for stop loss and take profit placement. The tool is compatible with cTrader 4.x and above and functions as a standalone indicator without external dependencies. It does not repaint and maintains a historical record of gaps for analysis.
Avis clients
5 | 50 % | |
4 | 50 % | |
3 | 0 % | |
2 | 0 % | |
1 | 0 % |


![Logo de "[Stellar Strategies] Inside Bar with Signals"](https://cdn.ctrader.com/image/webp/1d9e8bfa-3b2c-4440-bb37-5856902008a7_30683)