الوصف
📈 Trend Master Pro MultiMA – أداة الكشف النهائية عن الاتجاه 🚀
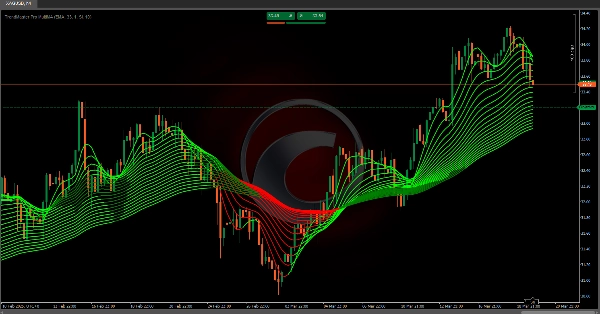
يقوم هذا المؤشر برسم 20 متوسطًا متحركًا بفترات مختلفة (5، 10، 15، 20، 25، 30، 35، 40، 45، 50، 55، 60، 65، 70، 75، 80، 85، 90، 95، و100). ولكل واحد منها:
1️⃣ 📊 اختر نوع الحساب الخاص بك: اختر بين SMA، EMA، RMA، WMA، أو VWMA بناءً على تفضيلاتك. اختياريًا، يمكنك تفعيل تنعيم الانحدار الخطي لتقليل الضوضاء والحصول على اتجاه أوضح.
2️⃣ 📏 حدد القناة المرجعية: يتم حساب قناة قائمة على نطاق السعر باستخدام آخر 200 شمعة. عرض القناة قابل للتعديل، يتوسع مع زيادة تقلب السعر ويتقلص في الأسواق الهادئة.
3️⃣ 📈 قارن المتوسطات المتحركة مع القناة: يتم تحليل كل متوسط متحرك بالنسبة إلى ارتفاع القناة و أعلى وأدنى قيمه خلال فترة محددة (الافتراضي: 20 شمعة).
- 📊 إذا تجاوز الفرق بين أعلى وأدنى قيمة للمتوسط المتحرك عرض القناة، فهذا يشير إلى اتجاه قوي (صاعد أو هابط).
- ⚖️ إذا كان الفرق ضمن القناة أو قريبًا منها، يعتبر السوق محايدًا أو متذبذبًا.
4️⃣ 🎨 نظام تلوين قائم على الاتجاه: يتم تلوين كل جزء من المتوسطات المتحركة وفقًا لقوة واتجاه الاتجاه:
- 🟢 أخضر = تم الكشف عن اتجاه صاعد
- 🔴 أحمر = تم الكشف عن اتجاه هابط
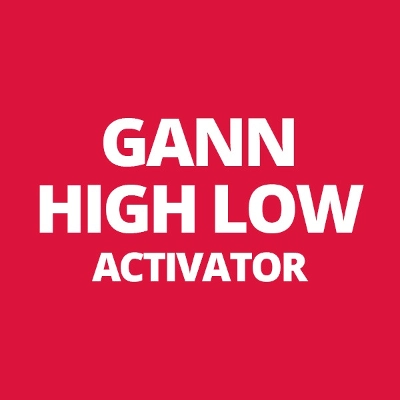
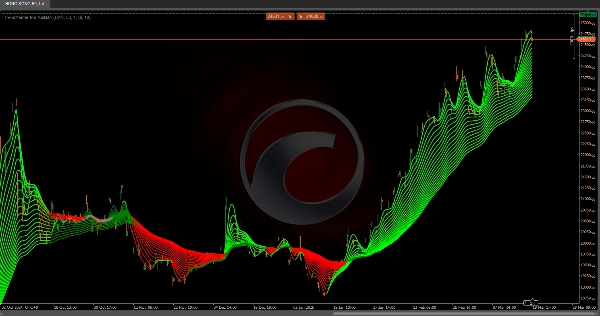
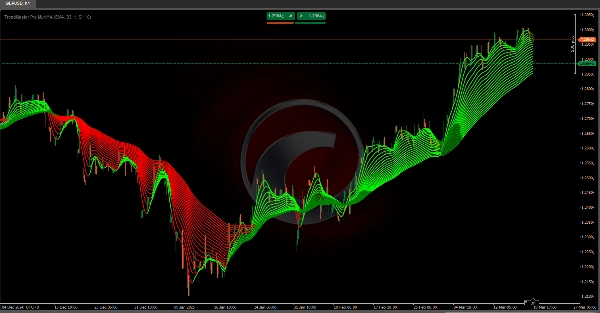
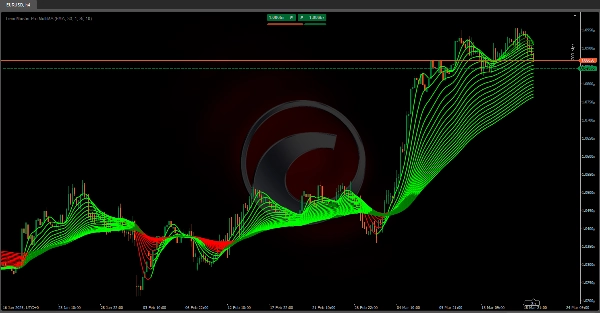
5️⃣ 📉 تصور الاتجاه: يقوم المؤشر بربط كل قيمة للمتوسط المتحرك من شمعة إلى أخرى، مكونًا هيكلًا يشبه المروحة من خطوط الاتجاه. كل متوسط متحرك يضبط لونه ديناميكيًا بناءً على الاتجاه المحسوب.
✅ لماذا تستخدم Trend Master Pro MultiMA؟
هذه النهج التكيفي متعدد الأطر الزمنية— التي تجمع بين عدة متوسطات متحركة، قنوات السعر، وتنعيم الانحدار— تساعد على التعرف السريع على مراحل السوق:
🔹 الاتجاهات الصاعدة ✅
🔹 الاتجاهات الهابطة ❌
🔹 الحركات العرضية/المتذبذبة 🔄
🚀 مثالي للمتداولين الذين يبحثون عن رؤى بصرية واضحة لاتخاذ قرارات أفضل في الأطر الزمنية القصيرة والمتوسطة والطويلة! 📊🔥
مؤشرات متجر Ctrader:
هيكل السوق الديناميكي
تحليل نقاط الانعطاف
انحدار فيبوناتشي الخطي
انحدار متعدد الأطر الزمنية
انحياز الشمعة متعدد المستويات
المتعقب
الملخص
Each moving average is compared against this channel and its own highs and lows over a defined period (default 20 candles). If the range of a moving average exceeds the channel width, it signals a strong bullish or bearish trend; if within or near the channel, the market is considered neutral or ranging. The indicator visually represents trends by connecting moving average values candle-to-candle, forming a fan-like structure of trendlines. Trend strength and direction are indicated by color coding: green for bullish and red for bearish trends.
This multi-timeframe adaptive tool integrates multiple moving averages, price channels, and regression smoothing to help traders quickly identify market phases—bullish, bearish, or ranging—across short, medium, and long-term timeframes.
تقييمات العملاء
5 | 100 % | |
4 | 0 % | |
3 | 0 % | |
2 | 0 % | |
1 | 0 % |