VWARSI_noSourceCode
指标
版本 1.0, Dec 2025
Windows 版、Mac 版
4.3
评价:3
说明
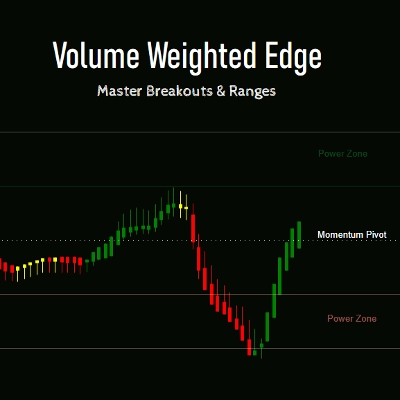
成交量加权优势:cTrader 动量的完整路线图
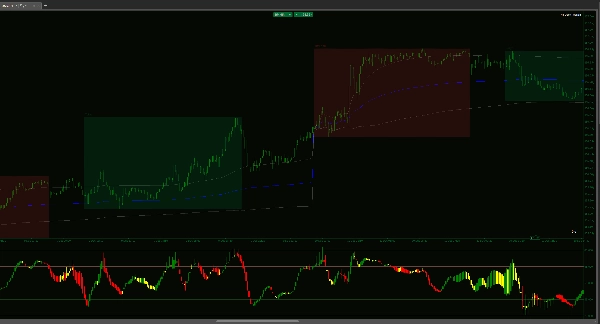
标准指标显示价格的历史走势。成交量加权 RSI 蜡烛图指标则展示了走势背后的信念。通过融合价格行为、成交量和五个关键的机构水平,该工具将 RSI 从简单的振荡器转变为全面的趋势映射系统。
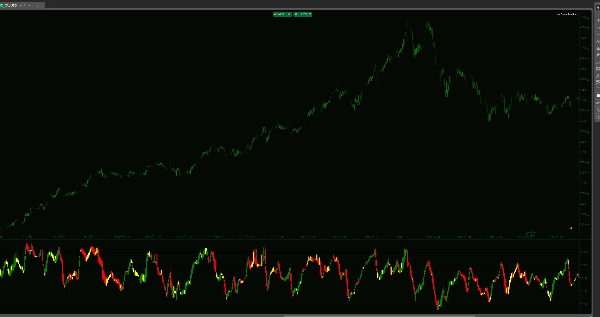
你得到的不是单一线条,而是在指标窗口中显示完整的 OHLC 蜡烛图。这让你能够看到动量的“结构”——揭示某一走势是由大量机构成交量支撑,还是仅仅是低流动性的“假突破”。
五区执行策略
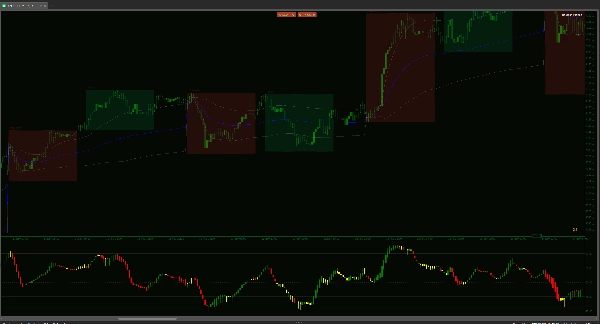
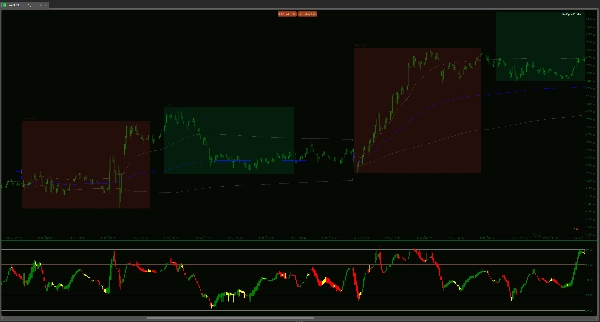
- 力量扩展区(65–80 & 20–35):这些是高信念区域。当成交量加权蜡烛图在这里持续时,你不是在寻找反转,而是在顺势而为。这是大资金运作的地方,也是最爆发性走势发生的区域。
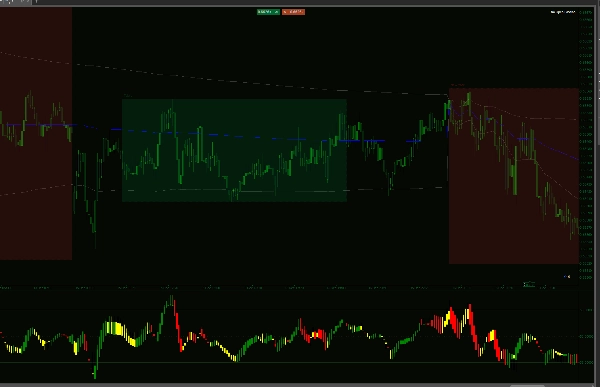
- 剥头皮走廊(50–65 & 35–50):非常适合亚洲时段或区间震荡市场。当更高时间框架的趋势中性时,这些区域提供高概率的“均值回归”目标。如果市场处于震荡,这些走廊让你能够精准剥头皮捕捉旋转。
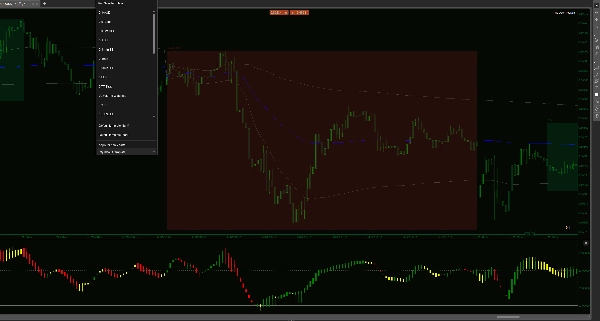
- 动量枢轴点(50):最终的分水岭。成交量加权蜡烛实体收盘穿越此水平,是市场控制权结构性转变的首个警告信号。
为何此工具改变你的工作流程
成交量加权清晰度:每根蜡烛通过价格变动乘以成交量计算得出。如果走势发生在薄弱成交量上,RSI 蜡烛不会确认它。这让你远离那些在价格图上看似良好但没有支撑的“陷阱”走势。
蜡烛实体洞察:传统 RSI 线条紧张且锯齿状。我们的 WMA 平滑蜡烛显示动量的“开盘”和“收盘”。如果 RSI 蜡烛实体厚实且坚固,趋势健康;如果影线长,动量已耗尽。
多市场多功能性:* 趋势交易:使用 65–80 区间以更长时间持有盈利交易。
区间/剥头皮:使用 35–65 走廊,在亚洲等低波动时段捕捉快速旋转。
避免“条形码”陷阱:大多数指标在低波动期让你猜测。此指标在盘整期间具有独特的视觉“条形码”效果。当蜡烛收紧、变平且转为中性时,指标告诉你“市场引擎”已关闭。此视觉警告帮助你避免进入低成交量的假突破,避免在价格运动背后无真实资金时被“割肉”。
原生 cTrader 优化:专为 C# API 构建,采用“最大视觉蜡烛”逻辑,确保即使在1分钟图表上平台依然响应迅速。
停止基于市场可能去向的交易。开始基于成交量实际推动方向的交易。此指标不仅仅是信号——它是理解市场内在能量的工具。
摘要
指标配置
客户评价
4.3
评价:3
5 | 33 % | |
4 | 67 % | |
3 | 0 % | |
2 | 0 % | |
1 | 0 % |
客户评价
December 28, 2025
December 27, 2025
The cleanest use is it brings another read without hijacking the plan. The market context still matters.
December 26, 2025
the noisy parts of the chart show up earlier, but the chart still needs say no.
讨论
常见问答
BTCUSD
Forex
Breakout
Indices
EURUSD
Commodities
GBPUSD
NZDUSD
RSI
Prop
Scalping
Crypto
Stocks
XAUUSD
NAS100
USDJPY
VWAP
cTrader Store 提供的所有产品,包括交易机器人、指标和插件,均由第三方开发者提供,仅供信息参考和技术访问之用。cTrader Store 并非经纪商,不提供投资建议、个人推荐或任何未来业绩保证。
该作者的其他作品


价格
注册日期 14/01/2025
55
销售
11.46K
免费安装