Description
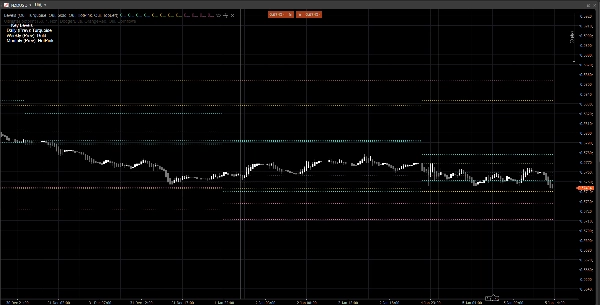
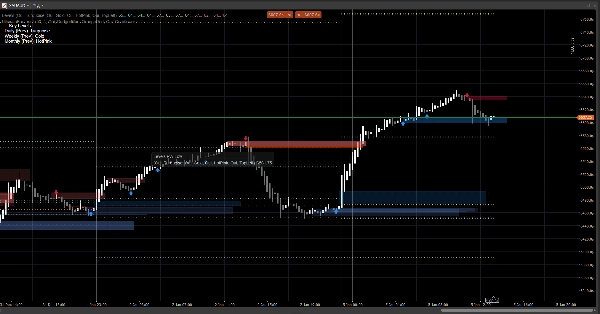
Zones d'action des prix est un indicateur léger et sans bruit qui trace les niveaux clés quotidiens, hebdomadaires et mensuels précédents directement sur votre graphique.
Il affiche :
- Jour précédent : Haut / Bas / Ouverture / Fermeture
- Semaine précédente : Haut / Bas / Ouverture / Fermeture
- Mois précédent : Haut / Bas / Ouverture / Fermeture
Ces niveaux sont largement utilisés comme zones de réaction, références de liquidité, et ancres contextuelles pour la structure du marché, les entrées, les objectifs et le placement du risque.
Pourquoi c’est utile
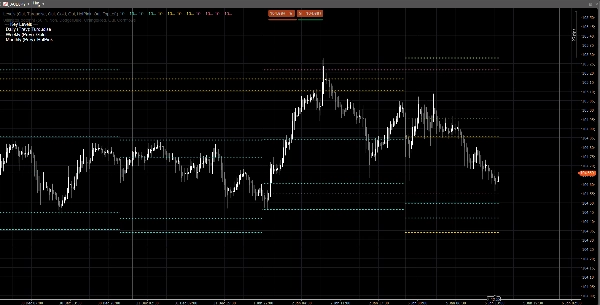
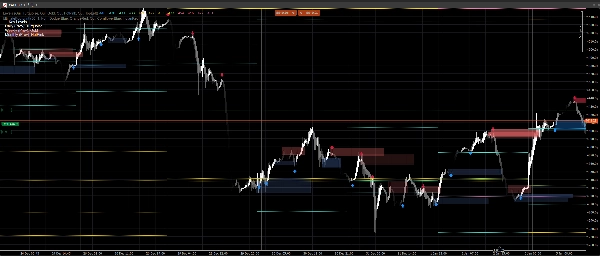
- Voir instantanément les niveaux de référence des périodes supérieures sans changer de graphique
- Vous aide à cadrer l'action des prix intrajournalière autour de PDH/PDL, PWH/PWL, PMH/PML
- Visuel épuré : les niveaux restent constants pour la session/semaine/mois en cours
- Fonctionne sur n'importe quel symbole et intervalle de temps
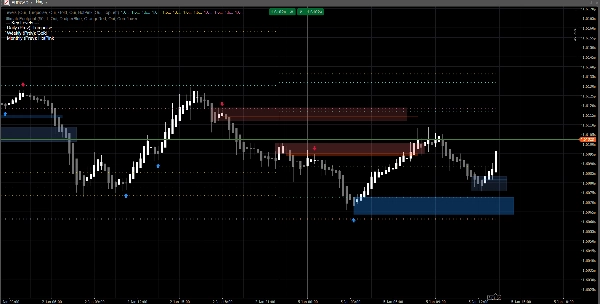
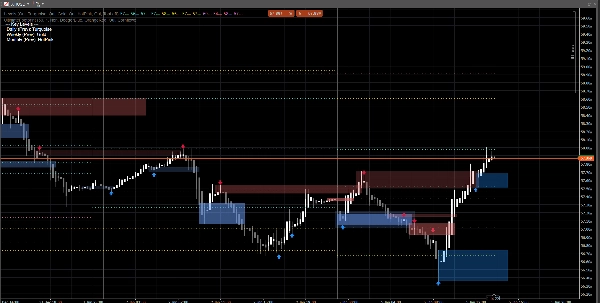
Personnalisation
Vous pouvez activer ou désactiver indépendamment chaque période :
- Afficher quotidien / hebdomadaire / mensuel
- Définir une couleur personnalisée pour chaque groupe
- Activer une légende simple, avec positionnement sélectionnable dans un coin
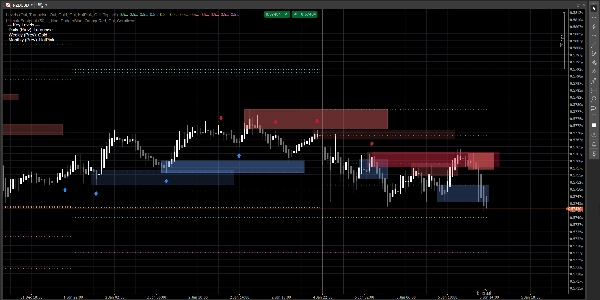
Notes techniques
- Les niveaux sont calculés en utilisant la bougie quotidienne/hebdomadaire/mensuelle précédente terminée (pas celle en cours de formation).
- Cela évite le repainting et maintient les niveaux stables pendant la session.
Avertissement
Cet indicateur est fourni uniquement pour le chartisme et le support à la décision. Il ne génère pas de signaux d'achat/vente et ne constitue pas un conseil financier. Gérez toujours le risque et validez avec vos propres données.
Les signaux sur le graphique sont générés par l'indicateur Ultimate Footprint disponible sur mon profil.